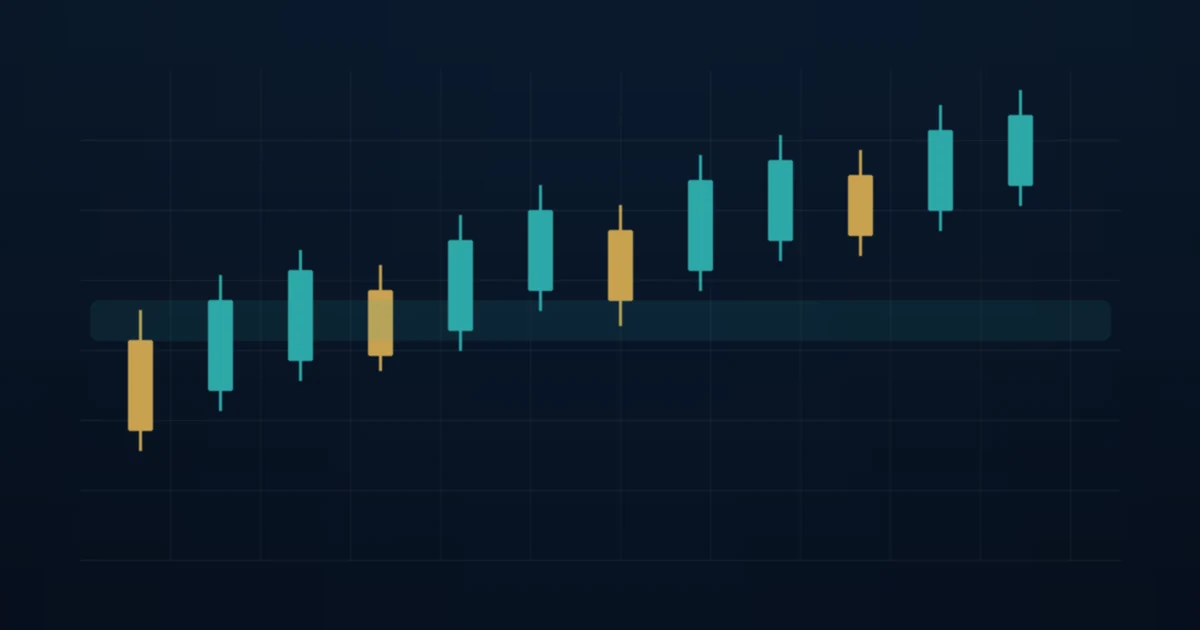
- Price action is a process: higher-timeframe structure, a zone, a trigger candle, then a written invalidation
- A candlestick means little in empty space; location and market regime decide whether it is information
- Naked charts still need rules — removing indicators does not remove the need for size, stop and news checks
- SMC/ICT labels are optional overlays on the same structure; they are not a separate market
- Spreads, slippage and session liquidity can invalidate a clean-looking candle as fast as a bad pattern can
- Quick Answer
- Short Answer
- Detailed Explanation
- Example
- Common Mistake
- Professional Tip
- What Price Action Is — and What It Is Not
- Short Answer
- Detailed Explanation
- Example
- Common Mistake
- Professional Tip
- The RMTI Loop: Read, Mark, Trigger, Invalidate
- Short Answer
- Detailed Explanation
- Example
- Common Mistake
- Professional Tip
- Structure First: Trend, Range, Break
- Short Answer
- Detailed Explanation
- Example
- Common Mistake
- Professional Tip
- Zones Beat Pattern Names
- Short Answer
- Detailed Explanation
- Example
- Common Mistake
- Professional Tip
- Price Action Versus SMC and Indicators
- Short Answer
- Detailed Explanation
- Example
- Common Mistake
- Professional Tip
- Worked Educational Setup (Hypothetical)
- Common Mistake
- Professional Tip
- When Price Action Is the Wrong Tool
- Short Answer
- Detailed Explanation
- Example
- Common Mistake
- Professional Tip
- Risk, Costs and Journaling
- Short Answer
- Detailed Explanation
- Example
- Common Mistake
- Professional Tip
- Checklist
- Glossary
- Related Reading
- Suggested Future Articles
Affiliate & risk disclosure: ForexTradeLab may earn a commission from qualifying broker links. That does not change the price you pay or replace independent checks. See the affiliate disclosure and risk disclaimer.
Educational only: Forex and CFDs are leveraged. You can lose more than a small deposit quickly, and a majority of retail CFD accounts lose money. This page is not investment advice and not a trade signal.
Quick Answer#
Short Answer
Price action trading means you read structure, zones and candles first, then decide. Indicators are optional. A trade idea is incomplete until you can state the invalidation price and the cash you will lose if that price prints.
Detailed Explanation
Retail forex is an OTC market whose global turnover is measured in the BIS Triennial Survey. Your platform chart is a broker feed, not a single exchange print. Price action still works as a language because traders react to prior highs, lows and round numbers. It fails as a religion when every wick is treated as a “signal” and size is taken from free margin instead of stop distance. Pair this page with how to read a forex chart and candlestick basics.
Example
Hypothetical Daily EUR/USD is in higher highs. Price pulls back into a prior 1.0820–1.0840 resistance zone that has flipped. An H1 candle closes back above the zone with a lower wick. Invalidation is a close back below 1.0810. That is a complete idea. A bullish engulfing in the middle of a range with no level is not.
Common Mistake
Collecting forty named candlestick patterns and taking every pin bar on M5.
Professional Tip
If you cannot explain the trade in one sentence without indicator names, you do not have a price-action plan yet.
What Price Action Is — and What It Is Not#
Short Answer
Price action is decision-making from the chart’s structure. It is not a promise that candles predict the next hour, and it is not the same as deleting every tool from the platform.
Detailed Explanation
A candlestick compresses open, high, low and close for a session or bar. Reading those four numbers in context is older than retail MetaTrader. What changed in social media is branding: “naked trading,” “smart money,” “ICT.” Under the labels, you are still asking four questions:
- Is the higher timeframe trending or ranging?
- Where has price repeatedly reacted?
- What is the current bar saying at that place?
- Where is the idea objectively wrong?
Indicators such as a 20-period average or RSI are lagging summaries of the same closes. They are not illegal in a price-action process. They become a problem when they replace question 4. For indicator use as confirmation only, see RSI, MACD and moving averages. For the wider skill stack, see what technical analysis is.
Example
Two traders see the same H4 pin bar. Trader A bought it because the pattern name is famous. Trader B bought it because Daily was already in higher lows, the pin sat on a weekly zone, and the stop sat beyond the wick with 0.7% cash risk. Same candle, different process.
Common Mistake
Calling a chart “price action” while still entering from an RSI cross with no level and no invalidation.
Professional Tip
Keep at most one optional filter (for example ATR for stop buffer). If the filter is doing the deciding, you have left price action.
The RMTI Loop: Read, Mark, Trigger, Invalidate#
This is the operating loop ForexTradeLab uses in education. It is a checklist, not a crystal ball.
| Step | Question | Typical tools | Fail condition |
|---|---|---|---|
| Read | Trend, range, or news regime? | Daily / H4 structure | You cannot say which of the three it is |
| Mark | Where is the nearest decision zone? | 2–3 rectangles, not 20 lines | Every swing is marked |
| Trigger | What candle proves interest at the zone? | Rejection, engulfing, retest close | You enter while the bar is still forming “because it looks like it” |
| Invalidate | What price kills the idea? | Stop beyond structure + spread buffer | Stop is a round number everyone else uses, with no size reduction |
Short Answer
Do not click until all four columns are filled on paper or in a journal.
Detailed Explanation
Read uses market structure: higher highs and higher lows versus lower highs and lower lows versus overlap. That is the same backbone as the trend / range / news playbook and multi-timeframe analysis.
Mark uses support and resistance as zones, not tripwires. Supply-demand language is a close cousin: supply and demand zones.
Trigger is a closed candle, not a live wick fantasy. Invalidate is where you size with the 1% risk examples and the lot calculator.
Example
Read: H4 lower highs. Mark: 1.0950–1.0970 supply. Trigger: bearish engulfing close back inside the zone. Invalidate: H4 close above 1.0985. Cash risk 1% on a $2,000 account is $20 before costs, so lot size comes from stop distance, not from “I can afford 0.10 because margin allows it.”
Common Mistake
Filling Read and Mark, then skipping Trigger because you are impatient, or skipping Invalidate because “the level always holds.”
Professional Tip
Journal the four fields before the trade. After the trade, mark which field was actually wrong. That is how you improve; P&L alone is too noisy.
Structure First: Trend, Range, Break#
Short Answer
A candle’s meaning changes with the regime. The same engulfing is a continuation tool in a trend and a fade tool only at the edge of a defined range.
Detailed Explanation
| Regime | Price-action job | Typical trigger | Typical mistake |
|---|---|---|---|
| Uptrend | Buy pullbacks into prior resistance-turned-support | Bullish rejection at the zone | Shorting every new high |
| Downtrend | Sell rallies into prior support-turned-resistance | Bearish rejection at the zone | Catching a falling knife with a hammer in empty space |
| Range | Fade the boundaries, not the midline | Wick rejection that closes back inside | Trading the middle “because RSI is oversold” |
| Break | Wait for close and retest | Retest hold, then continuation close | Chasing the first spike through the level |
Forex liquidity is not even across the day. Session overlap and news change how honest a wick is. Pair structure reading with market hours, liquidity and slippage.
Example
GBP/USD (hypothetical) spends two weeks between 1.2680 and 1.2780. A long-wicked hammer at 1.2685 that closes back above 1.2700 is information. The same hammer at 1.2730, in the middle of the box, is noise.
Common Mistake
Applying a “trend continuation” pin bar checklist inside a range, then calling price action broken.
Professional Tip
If Daily and H1 disagree, the smaller chart is a timing tool, not a licence to reverse the Daily bias.
Zones Beat Pattern Names#
Short Answer
Learn five behaviours at levels. Do not memorise a museum of candle names.
Detailed Explanation
Useful behaviours:
- Rejection wick: long shadow, close back inside the zone.
- Engulfing close: current body fully covers prior body, in the direction of your bias.
- Inside bar: compression; trade the break of the mother bar only if it occurs at a level.
- Break and retest: close through a zone, pullback holds, then continue.
- Failed break: spike through, close back inside — often the start of a move the other way, not a reason to widen a stop.
These overlap with candlestick teaching on pin bars, engulfing and doji. The difference is selectivity: location first.
Round numbers (1.1000, 1.2500, 150.00 on USD/JPY) attract orders. Treat them as zones with width, not as magic.
Example
A “perfect” bullish engulfing prints 40 pips away from any Daily level during the Asian session on a thin cross. Spread is already 2.5 times the London average. Pass. The pattern name does not pay the spread.
Common Mistake
Screenshotting winners that occurred at levels, then taking losers that were the same pattern in empty space.
Professional Tip
If you need a Fibonacci retracement to justify the zone, require a prior swing reaction as well. Tools should confirm a level you can already see. Gold-specific Fibonacci notes live in the XAU/USD Fibonacci guide, which is a cluster page, not a substitute for this framework.
Price Action Versus SMC and Indicators#
Short Answer
SMC is a labelled dialect of price action. Indicators are summaries. Neither replaces invalidation.
Detailed Explanation
Smart Money Concepts maps liquidity pools, fair value gaps and order blocks. Those ideas can help you avoid buying the first breakout through an obvious high. They can also become a drawing hobby. If you cannot define a setup without the label, you do not have a rule.
A moving average can show you the same higher-low sequence more slowly. RSI can warn that a trend pullback is stretched. Use them as vetoes, not as entries.
Example
You mark equal Daily highs. Price runs through them by 12 pips and closes back below. SMC calls that a liquidity sweep. Classic price action calls that a failed break. The trade plan can be identical: wait for a lower-timeframe shift, stop above the sweep, target the open range. The vocabulary is optional.
Common Mistake
Redrawing order blocks after the move so every winner looks “smart.”
Professional Tip
Pick one vocabulary for three months. Switching jargon mid-journal destroys your sample.
Worked Educational Setup (Hypothetical)#
Numbers below are classroom figures, not a live call.
| Field | Example |
|---|---|
| Pair / chart | EUR/USD, Daily bias, H1 trigger |
| Read | Higher highs from 1.0700 toward 1.0900 |
| Mark | 1.0820–1.0840 prior supply, now demand |
| Trigger | H1 close back above 1.0840 after a dip into the zone |
| Invalidate | H1 close below 1.0810 |
| Risk | 0.8% of $3,000 = $24 before spread and slippage |
| Size | Derived from stop distance × pip value, then rounded down to the broker’s volume step |
| Skip rules | 30 minutes either side of US CPI; spread more than 1.5× the session median |
If the stop is 35 pips on EUR/USD, a micro-lot (0.01) is about $3.50 per 35 pips at a $10-per-pip standard-lot convention scaled down. You would not use 0.10 lots just because margin on a 1:30 or 1:500 account allows it. Leverage changes collateral, not the cash loss at the stop. See what leverage is and best leverage for beginners.
Common Mistake
Using the same lot size on gold because “price action is the same.” Gold’s dollar-per-point is not EUR/USD’s dollar-per-pip. Use how much 0.01 lot makes before you copy a template.
Professional Tip
Save the screenshot before entry with the four fields typed on it. Hindsight charts lie.
When Price Action Is the Wrong Tool#
Short Answer
Stand aside when the feed is an event, not a market.
Detailed Explanation
Price action assumes that the last few candles are comparable. They are not comparable across:
- NFP, CPI, FOMC and similar scheduled shocks — see should beginners trade news
- Sunday reopen gaps — weekend gap risk
- Extremely thin crosses in the Asian afternoon
- Widened spreads that already consume your planned R
A beautiful rejection that fills 8 pips worse than the close is not a “failed pattern.” It is an execution cost. Log it.
Example
You planned a 20-pip stop. At the click, EUR/USD spread jumps from 0.8 to 4.2 pips around a data release. The candle still “looks” like a pin. You do not have 20 pips of risk anymore.
Common Mistake
Moving the stop farther after a news wick so the pattern remains “right.”
Professional Tip
Write a hard skip window on the calendar. Price action skill includes not trading.
Risk, Costs and Journaling#
Short Answer
The method dies without a cash cap, a cost log and a review habit.
Detailed Explanation
Use the forex risk management guide, expectancy and win-rate math, and a trading journal template. Record spread at entry, slippage, and whether you followed RMTI. A 55% win rate with 1:0.8 reward after costs is still a losing business.
Regulated CFD firms must warn that a large share of retail accounts lose money. The FCA CFD page and CFTC investor materials exist because leverage and marketing outrun skill. Price action does not create an exemption.
Example
20 trades, 12 wins of +1R, 8 losses of −1R, average extra cost 0.15R. Net is not +4R; it is closer to +1R after costs. That is still useful information. It is not a salary.
Common Mistake
Deleting losing screenshots so the journal “proves” price action works.
Professional Tip
Review weekly: count rule breaks, not only P&L. Rule breaks predict the next drawdown better than last week’s winners.
Checklist#
- Daily or H4 bias written in one line
- At most three zones on the working chart
- Trigger defined as a closed candle
- Invalidation beyond structure, not on the wick extreme everyone sees
- Position size from cash risk, using the lot calculator
- News window checked
- Session and spread checked
- Journal fields filled before the order
Next step: practise RMTI on a demo chart for 30 closed candles at levels, then size live risk with the 1% rule examples. If you later compare a broker’s platform and costs, read live terms first. XM availability depends on country and legal entity — eligibility is not a trading edge.
Glossary#
- Price action — Decisions based on structure, zones and candles rather than indicator signals as the primary reason to click.
- Invalidation — The price that proves the idea wrong; the stop belongs beyond it, not on a hopeful round number.
- Trigger — A completed bar that confirms interest at a pre-marked zone.
- Zone — A price area of prior reactions, wider than one pip.
- Failed break — A move through a level that cannot hold and closes back inside.
- R — The planned cash risk of one trade, used to express wins and losses in comparable units.
Related Reading#
- How to read a forex chart
- Support and resistance
- False breakout forex guide
- Bollinger Bands squeeze and walk
- Forex stop hunting explained
- Stop-loss and take-profit placement
- Technical analysis for beginners
- Ultimate forex guide
Suggested Future Articles#
- Price action pullback vs breakout: a two-setup journal template
- Session-specific price action: London open versus New York afternoon
- How to grade a pin bar: a 10-point selectivity scorecard
Risk warning: CFDs are complex leveraged products. A majority of retail client accounts lose money. Hypothetical chart levels are educational. Confirm contract specifications with your broker and read the ForexTradeLab disclaimer.
Comments
Add a useful note for other traders. We review comments before publishing.