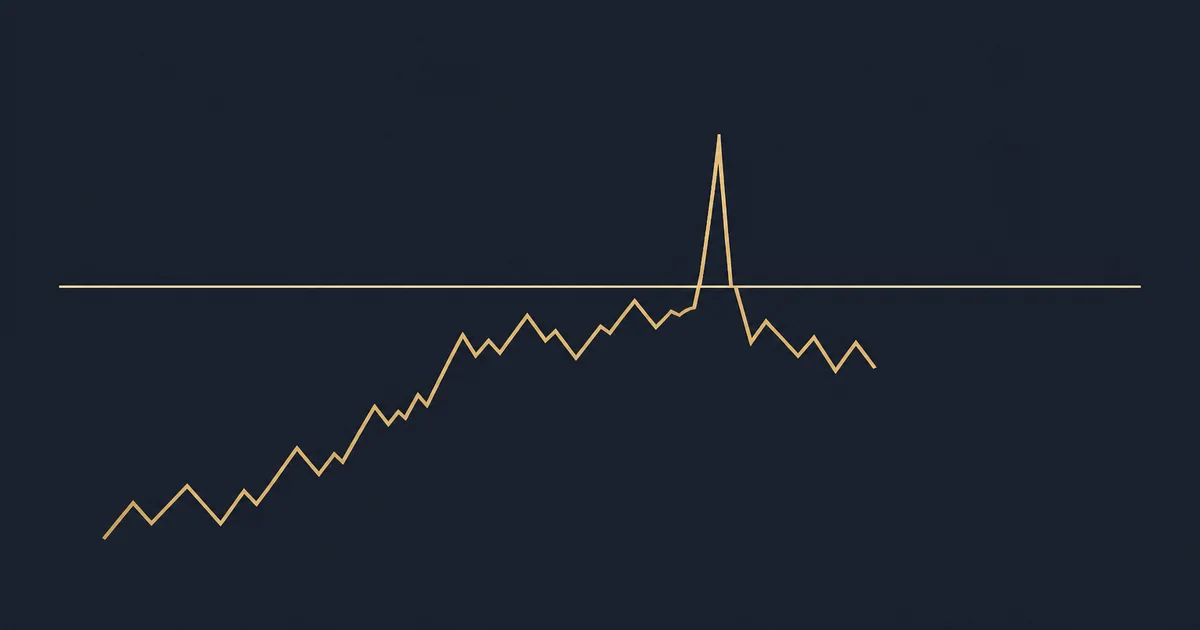
- A breakout is a close beyond a pre-marked level on your trading timeframe — a wick through the level is a probe, not a regime change
- Spot forex has no central exchange tape; do not import stock-market volume rules as confirmation
- A held retest (old resistance acts as support, or the reverse) is how many genuine breaks prove themselves
- A failed break is a close back inside the range; that close is the information, not the first spike
- Asia-range sweeps at the London open and news spikes are common fake-break engines
- Stops belong beyond the failed structure plus a volatility buffer; fading every wick is not a system
 Regulated Global Broker
 Trusted by 20M+ traders — open your account in minutes
- Trade 1,400+ instruments
- Country-based bonus offers where eligible
- MT4 & MT5 available
- Easy deposits and withdrawals
- Leverage up to 1000:1, where available
- Copy Trading: auto-copy expert strategy managers
- Quick Decision Framework
- Short Answer
- Detailed Explanation
- Example
- Common Mistake
- Professional Tip
- Quick Answer
- Wick Versus Close — The Only First Filter
- Short Answer
- Detailed Explanation
- Example
- Common Mistake
- Professional Tip
- Why False Breaks Are Common in Forex
- Short Answer
- Detailed Explanation
- Example
- Common Mistake
- Professional Tip
- The Held Retest Versus the Failed Break
- Short Answer
- Detailed Explanation
- Example
- Common Mistake
- Professional Tip
- Four Pictures You Will Actually See
- 1. Range fake (the textbook)
- 2. Trendline fake
- 3. News spike
- 4. Asia sweep at London
- Tick Volume — Why Copy-Paste Equity Rules Fail
- Short Answer
- Detailed Explanation
- Example
- Common Mistake
- Professional Tip
- Risk Math for a Failed-Break Fade
- Short Answer
- Detailed Explanation
- Example
- Common Mistake
- Professional Tip
- A Diagnostic Table
- Checklist
- Glossary
- Related Reading
- Suggested Future Articles
Affiliate & risk disclosure: ForexTradeLab may earn a commission from qualifying broker links. That does not change your price or replace entity checks. See the affiliate disclosure and risk disclaimer.
Educational only: Forex and CFDs are leveraged. You can lose more than a small deposit quickly, and a majority of retail CFD accounts lose money. A failed break on a demo chart is not a live signal. Stops can slip in fast markets.
Quick Decision Framework#
Short Answer
A false breakout is a move through a level that does not hold. Judge it by the close on the timeframe you trade, not by the wick that excited the chat group.
Detailed Explanation
Retail charts make breakouts look binary: price was below resistance, then it was above, so the market “chose up.” Real order flow is messier. Stops cluster beyond obvious highs and lows. The first print through that pool is often a liquidity run. If the close returns inside the range, the level has not changed role — old resistance is still resistance. If the close holds beyond and a later pullback holds as support, you have a candidate for a real break.
Spot FX is not a single exchange. The BIS Triennial Survey describes a vast OTC market. Your candle is your broker’s book. A wick on MT5 can differ by a few tenths of a pip from another book and still be honest. That is why this guide does not tell you to confirm breakouts with “1.5× average volume” copied from equities. Tick volume is a count of quotes, not shares changing hands.
Example
Illustrative. EUR/USD H1 range 1.0820–1.0860. An H1 candle spikes to 1.0867 and closes at 1.0854. That is a wick-only probe. The breakout thesis is not confirmed. A later H1 that closes at 1.0868, then an H1 pullback that holds 1.0860 and continues, is a held retest — still not a guarantee, but a different diagnosis.
Common Mistake
Entering long at the spike high because “it broke,” then placing the stop just under the round number everyone else used. The fake-out was designed around that stop cluster. See stop hunting explained.
Professional Tip
Write the level before the probe. If you draw the line after the wick, you will always find a breakout. Pair this page with support and resistance so the level existed in the journal first.
Quick Answer#
What is a false breakout in forex? Price leaves a pre-marked range or trendline and fails to stay gone. The working test is:
- Was the level marked in advance?
- Did the trading-timeframe candle close beyond it?
- Did a later test hold (real break) or close back inside (failed break)?
- Was the print a session sweep or a news spike?
If you cannot answer those four, you do not have a breakout trade. You have a moving candle.
Related cluster: price action framework, London / NY breakout playbook, Bollinger squeeze and walk.
Wick Versus Close — The Only First Filter#
Short Answer
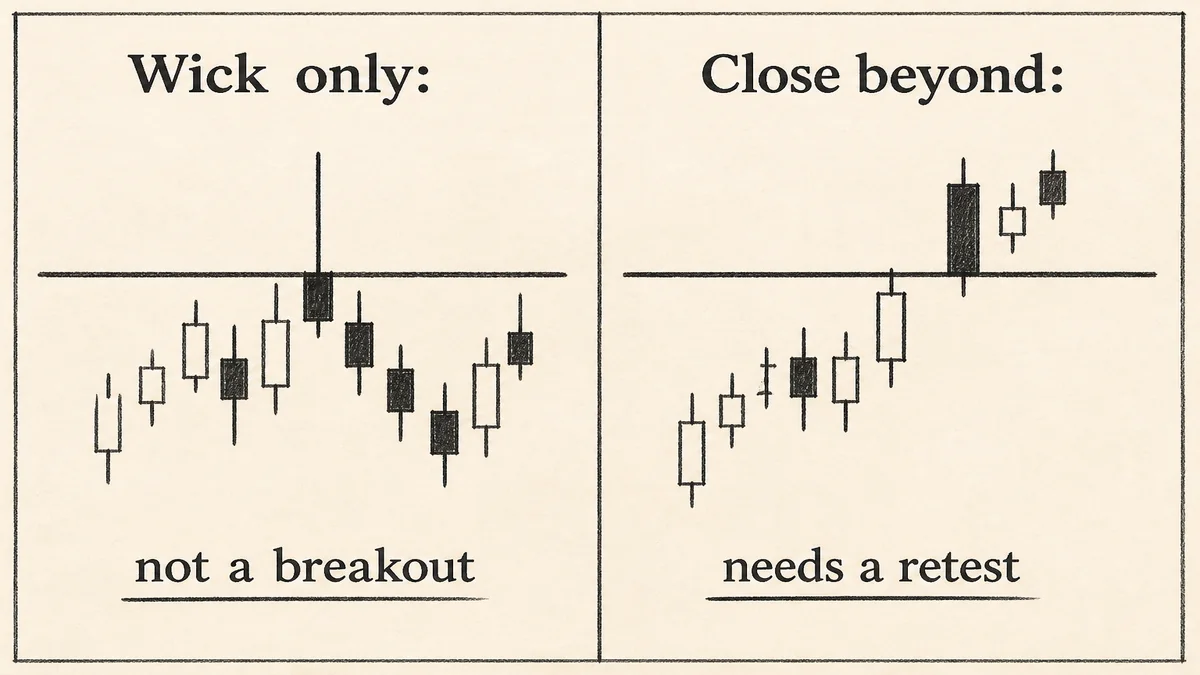
Wicks probe. Closes decide. On the timeframe you actually trade.
Detailed Explanation
A wick is the auction going to a price and being rejected inside that bar. A close is where the bar surrendered. Breakout traders who enter on the tick that first prints beyond 1.0860 are trading the probe. Breakout traders who wait for the H1 close are trading the decision. Neither is magic. The close filter simply removes the largest pile of noise: stop runs that never change the range.
MetaTrader charting plots Bid by default on many FX symbols. Your long entry fills at Ask. A “break” of resistance on a Bid chart can look cleaner than the Ask you would have paid. Combine this with bid/ask mechanics before you call the broker a thief.
Example
Illustrative. Resistance 1.1000. M15 wick high 1.1008, M15 close 1.0994. H1 still inside the range. If your plan is an H1 breakout, nothing happened. If your plan is M15, you still need the close beyond 1.1000, not the wick.
Common Mistake
Dropping to M1 after an H4 wick so you can “catch the fake.” You are now trading a different market.
Professional Tip
Put the working timeframe in the journal header. Judge the break only there. Use a lower timeframe for execution after the close, not to invent the close.
Why False Breaks Are Common in Forex#
Short Answer
Stops cluster, sessions hand off, news gaps the book, and there is no single tape.
Detailed Explanation
Four engines show up again and again:
1. Clustered stops. Traders park sells under the obvious swing low and buys above the obvious high. Taking that liquidity can print a wick and reverse. That is structure plus liquidity, which is why this page links to stop hunting without repeating it. A false breakout is the chart diagnosis. Stop hunting is one cause.
2. Session handoff. The Asia range is a box of stops. London’s first impulse often sweeps it. The London volatility playbook already warns that the first move frequently fakes. This guide is the general rule: sweep, then reclaim, beats buy the first print.
3. News and gaps. CPI, NFP, FOMC and weekend gaps can print through a level at a price you never could have traded at the line you drew. CFTC educational material on stop orders is explicit: stops become market orders and can fill worse. A “breakout” on the news candle is often a spread-and-slippage event. See USD news playbook and should beginners trade news.
4. Wide spreads. Rollover and thin books can stretch a candle across a level on the chart while the tradable Bid/Ask never offered a clean break. That is not a strategy. It is a reason to skip. All-in costs belong in the diagnosis.
Example
Illustrative. GBP/USD Asia high 1.2720. London 07:05 GMT prints 1.2734, then 08:00 GMT H1 closes 1.2712. The breakout traders who bought 1.2730 supplied the liquidity. The close said the box still exists.
Common Mistake
Calling every wick “manipulation.” Most are clustered orders plus a session. Abuse is a pattern versus independent prices, not one screenshot.
Professional Tip
If the same wick appears on a second broker feed and on a recognised data chart, treat it as market. If only your book spiked, save the ticket and read the entity’s execution policy — that is due diligence, not a candlestick pattern.
The Held Retest Versus the Failed Break#
Short Answer
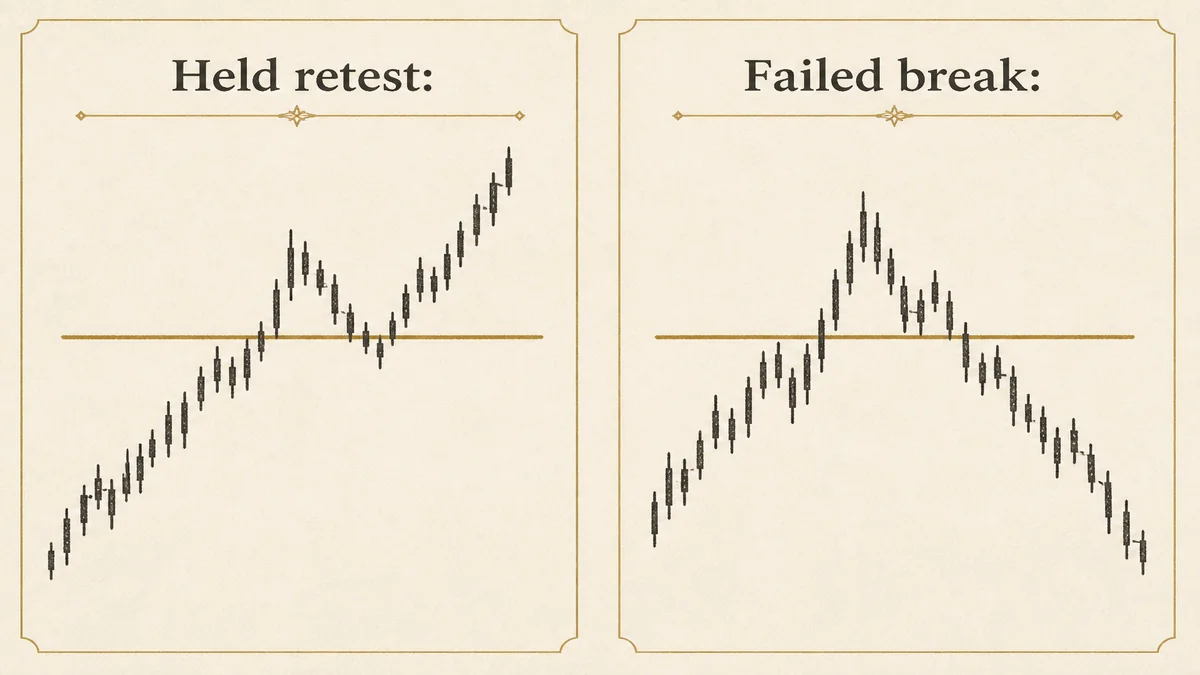
Held retest: level changes role and holds. Failed break: close back inside, then follow-through the other way.
Detailed Explanation
A close beyond the level is necessary, not sufficient. Many real breaks pause. Price returns to the broken line. If buyers defend former resistance, the role change is visible. If the bar closes back through the line, the breakout traders are trapped. Their exits add to the reversal. That trapped-trader flow is why failed breaks can travel. It is also why amateurs fade too early — they sell the first green close beyond resistance, which was the continuation bar.
Sequence for a bullish genuine-break candidate:
- Pre-marked resistance.
- Close above on the trading timeframe.
- Pullback into the level.
- Rejection or hold, close still above (or only a shallow pierce).
- Stop below the retest swing, sized in cash.
Sequence for a bearish failed-break candidate:
- Same pre-marked resistance.
- Probe or close above that does not hold.
- Close back inside the range.
- Stop above the failed extreme plus buffer.
- Target range midline or opposite side — not “unlimited.”
Gold follows the same logic with larger distance. Do not copy EUR/USD pip stops onto XAU/USD. See gold support and resistance.
Example
Illustrative H4 EUR/USD. Resistance 1.0900. H4 closes 1.0918. Next H4 dips to 1.0902 and closes 1.0925. Held retest. Alternative: H4 closes 1.0918, next H4 closes 1.0888. Failed break. Same first close, opposite second close. The second close is the information amateurs skip.
Common Mistake
Entering the fade at the wick high with a 5-pip stop. The fake can fake you. Buffer exists for a reason; ATR stops translate that into size.
Professional Tip
One retest attempt. If the hold fails, you are done. Averaging into a “it must fail” story is how ranges become trends against you.
Four Pictures You Will Actually See#
1. Range fake (the textbook)#
A box. Spike through one side. Close back in. Trade only after the failed close, toward the interior, with a stop beyond the spike. Invalid if a later bar closes and stays beyond.
2. Trendline fake#
A rising line of higher lows. One close below that looks like a breakdown, then a reclaim. Trendlines are subjective; two traders draw two lines. Prefer horizontal reactions when you are learning. If you use a trendline, require the close and a reclaim of the last swing, not a touch.
3. News spike#
A vertical bar through three levels at once. Spreads 3–10× normal. The “breakout” is untradeable at the prices you imagined. Default: flat. If you already had a position, you are in slippage physics — why stops fill worse — not in a pattern.
4. Asia sweep at London#
Overnight box, London impulse through the high or low, reclaim inside the first 60–120 minutes. This is the session-specific version of picture 1. Do not run a London breakout system during a dead Asia range without accepting you are hunting the sweep.
Tick Volume — Why Copy-Paste Equity Rules Fail#
Short Answer
Tick volume ≠ exchange volume. In retail FX it is usually how many times price updated.
Detailed Explanation
Equity breakout articles can cite NYSE or Nasdaq volume because there is a tape. OTC FX has dealers, ECNs and internalisation. Your platform’s “volume” histogram is typically tick volume. A fast, thin spike can print high tick volume because quotes flickered, not because a real-money bid absorbed size. A slow grind can print modest ticks and still be the real break.
Use tick volume, if you use it at all, as a minor tie-break after close and structure. Never as the main reason you clicked.
Example
Illustrative. Two M15 breaks of 1.0800. Both close at 1.0812. Bar A has 2× typical ticks during NFP. Bar B has average ticks at 10:00 London on a data-quiet Tuesday. Bar A is more likely a news event than a clean level change. Bar B is the one you can actually study as structure.
Common Mistake
Waiting for “volume confirmation” that your FX platform cannot provide, then chasing after three extra candles.
Professional Tip
Confirm liquidity regime with the clock and the spread, not with a histogram copied from stocks. Market hours and slippage is the practical overlay.
Risk Math for a Failed-Break Fade#
Short Answer
The stop goes beyond the failed extreme, so the lot is usually smaller than a tight “just over the high” stop.
Detailed Explanation
Illustrative $4,000 account, 1% = $40. EUR/USD failed high 1.08740, close back 1.08580. You sell 1.08570. Invalidation 1.08790 (extreme plus 5 pips buffer). Distance = 22 pips. At ~$1 per pip per 0.10 lot, lot ≈ 0.18. A 8-pip stop at 1.08650 would allow 0.50 lots and would be inside the wick that already proved it can print there.
FCA CFD and CFTC warnings exist because leverage makes that 0.50-lot choice look free until the second fake-out.
Example
Same structure on gold with a $12 buffer instead of 5 pips. If the distance in dollars per 0.01 lot exceeds your 1% cap at the broker’s minimum lot, skip. Minimum lot too big is the correct outcome.
Common Mistake
Targets at 1:5 on a range fade. The opposite side of a 40-pip range is a 1:1 to 1:2 idea after spread. Fantasy R-multiples belong in marketing threads.
Professional Tip
Take partial at the midline if you cannot watch the opposite side. Greed on a fade is how a winner becomes the third wick.
A Diagnostic Table#
| Observation | Working diagnosis | Default action |
|---|---|---|
| Wick beyond, close inside | Probe / likely fake | No breakout entry; optional fade only after rules |
| Close beyond, no retest yet | Unconfirmed break | Wait or reduce size |
| Close beyond, retest holds | Role-change candidate | Trade with stop beyond retest swing |
| Close beyond, next bar closes back in | Failed break | Fade only with written invalidation |
| Spike into CPI/NFP/FOMC | News event | Stand aside |
| Only your broker printed the spike | Book question | Log fills; do not pattern-trade it |
Checklist#
- Level marked before the move
- Trading timeframe named
- Close used, not the wick, for the breakout decision
- Session and calendar checked
- Spread compared with a normal hour
- Retest versus failed-close named in one line
- Stop beyond the failed extreme plus buffer
- Lot from cash risk via the lot calculator
- One attempt, no average
- Screenshot in the journal with the pre-drawn level visible
Next step: on demo, mark one range on H1 and classify the next 20 probes as wick-only, held retest, or failed close — before P&L. Then keep live risk inside the 1% examples. A broker does not fix a wick addiction. Eligibility still depends on country and entity — XM availability is not a strategy.
Glossary#
- False breakout / fakeout — A move through a level that does not hold on the close and follow-through you require.
- Probe — A wick beyond a level; information, not a regime change by itself.
- Held retest — After a close beyond, a pullback to the level that holds and preserves the new role.
- Failed break — Close back inside the prior range after a break attempt.
- Role change — Resistance becoming support, or support becoming resistance.
- Sweep — Price trading through a pool of clustered stops, often at a session open.
- Tick volume — Count of price updates on a retail FX chart; not exchange share volume.
Related Reading#
- Bollinger Bands squeeze and walk
- Support and resistance
- Price action framework
- Stop hunting explained
- London session and NY open
- How to set stop-loss and take-profit
- Chart patterns
- Technical analysis pillar
Suggested Future Articles#
- Failed break versus liquidity sweep: a side-by-side journal with two screenshots
- Trendline breaks: why two traders see two different fakes
- Measuring fake-out frequency by session on EUR/USD without claiming a universal win rate
Risk warning: CFDs are complex leveraged products. A majority of retail client accounts lose money. Hypothetical levels are educational. Stops can slip. Confirm contract specifications with your broker and read the ForexTradeLab disclaimer.
Comments
Add a useful note for other traders. We review comments before publishing.