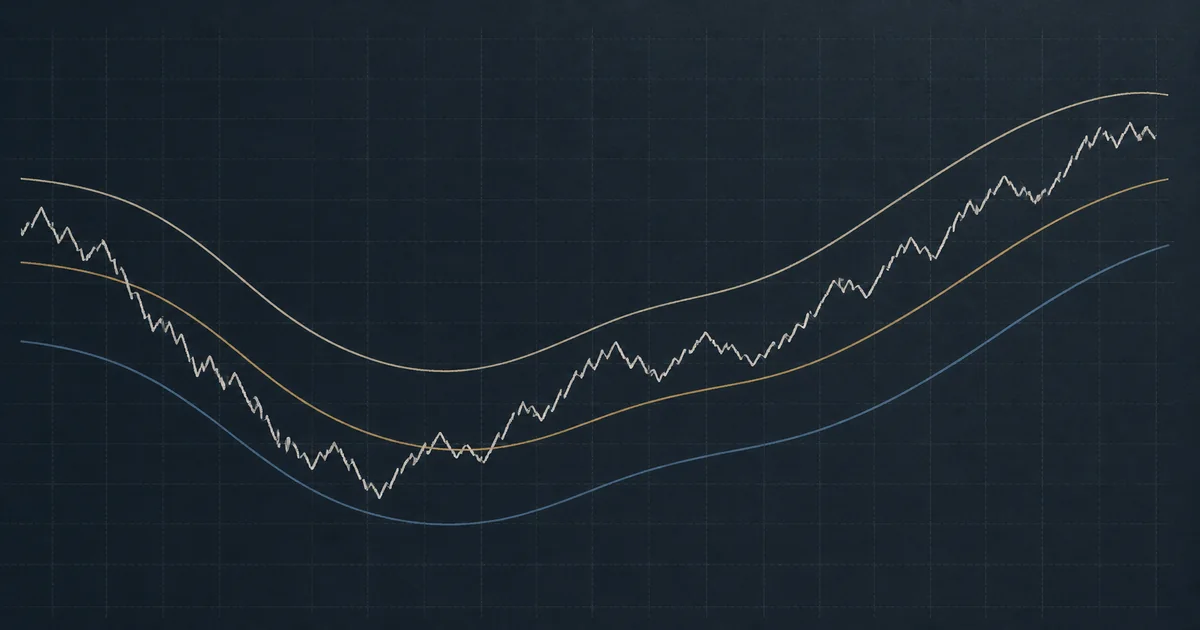
- Bollinger Bands measure how far price sits from a 20-period simple average in units of recent standard deviation — they do not forecast direction
- A tag of the upper or lower band is not a buy or sell signal; in a trend, price can walk the band for many candles
- Closes outside the bands are continuation first, reversal later — John Bollinger’s own rule, and the basis of volatility-breakout systems
- BandWidth locates a squeeze; %b locates where the close sits between the bands
- The popular 95% containment claim is a normal-distribution shortcut; Bollinger warns that security returns are non-normal and that about 90% of closes sit inside the default bands in practice
- When bands expand, stop distance expands — cut lot size so cash risk stays fixed
 Regulated Global Broker
 Trusted by 20M+ traders — open your account in minutes
- Trade 1,400+ instruments
- Country-based bonus offers where eligible
- MT4 & MT5 available
- Easy deposits and withdrawals
- Leverage up to 1000:1, where available
- Copy Trading: auto-copy expert strategy managers
- Quick Decision Framework
- Short Answer
- Detailed Explanation
- Example
- Common Mistake
- Professional Tip
- Quick Answer
- What Bollinger Bands Actually Measure
- Short Answer
- Detailed Explanation
- Example
- Common Mistake
- Professional Tip
- The 95% Myth — What the Math Does Not Promise
- Short Answer
- Detailed Explanation
- Example
- Common Mistake
- Professional Tip
- %b and BandWidth — The Two Numbers Worth Writing Down
- Short Answer
- Detailed Explanation
- Example
- Common Mistake
- Professional Tip
- Regime 1 — The Squeeze
- Short Answer
- Detailed Explanation
- Example
- Common Mistake
- Professional Tip
- Regime 2 — Walking the Band
- Short Answer
- Detailed Explanation
- Example
- Common Mistake
- Professional Tip
- Regime 3 — Mean Reversion Inside a Range
- Short Answer
- Detailed Explanation
- Example
- Common Mistake
- Professional Tip
- How to Add the Indicator Without Fooling Yourself
- Worked Risk Math — Same Band, Different Lot
- Short Answer
- Detailed Explanation
- Example
- Common Mistake
- Professional Tip
- Combining Bands with Structure — A Repeatable Sequence
- Common Bollinger Mistakes in Forex
- Checklist
- Glossary
- Related Reading
- Suggested Future Articles
Affiliate & risk disclosure: ForexTradeLab may earn a commission from qualifying broker links. That does not change your price or replace entity checks. See the affiliate disclosure and risk disclaimer.
Educational only: Forex and CFDs are leveraged. You can lose more than a small deposit quickly, and a majority of retail CFD accounts lose money. Bollinger Bands organise volatility; they do not produce a guaranteed edge. This page is not a trade signal.
Quick Decision Framework#
Short Answer
Bollinger Bands are a volatility envelope around a 20-period simple average. Use them to see whether the market is compressed, trending along a band, or mean-reverting inside a range. A touch of the upper or lower band is not a buy or sell order.
Detailed Explanation
John Bollinger designed the bands as a relative definition of high and low: price is high at the upper band and low at the lower band versus recent history, not versus a forecast. His published rules are blunt on the two mistakes this article exists to stop. First, tags are not signals. Second, closes outside the bands are continuation first. MetaTrader 5 documents the same envelope: bands widen when volatility rises and contract when it falls, unlike a fixed-percentage envelope.
That is why a squeeze is a volatility event. It does not include direction. Walking the upper band during a London trend day is the market telling you the trend is in control. Fading that walk because “price is overbought” is how a mean-reversion habit collides with a trending session.
Example
Illustrative only. On an H4 EUR/USD chart the 20-period middle band is 1.0840, the upper band 1.0890, the lower band 1.0790. BandWidth is (1.0890 − 1.0790) / 1.0840 ≈ 0.9%. If last week’s BandWidth was 1.6%, you are looking at a squeeze, not a buy. A later close at 1.0905 is an outside close — continuation first, not an automatic short.
Common Mistake
Shorting every upper-band tag on USD/JPY during a yield-driven trend, then doubling the lot when the next tag also fails. The indicator was describing stretch. The trader was inventing a reversal.
Professional Tip
Write the regime before the entry: squeeze, walk, or range. If you cannot name it in one line, you are using the bands as decoration. Then size from ATR or structure so a wider envelope does not silently raise cash risk.
Quick Answer#
How do you use Bollinger Bands in forex? Treat them as a map of stretch and volatility, then trade your actual method — breakout, pullback or range — only when the map matches the method.
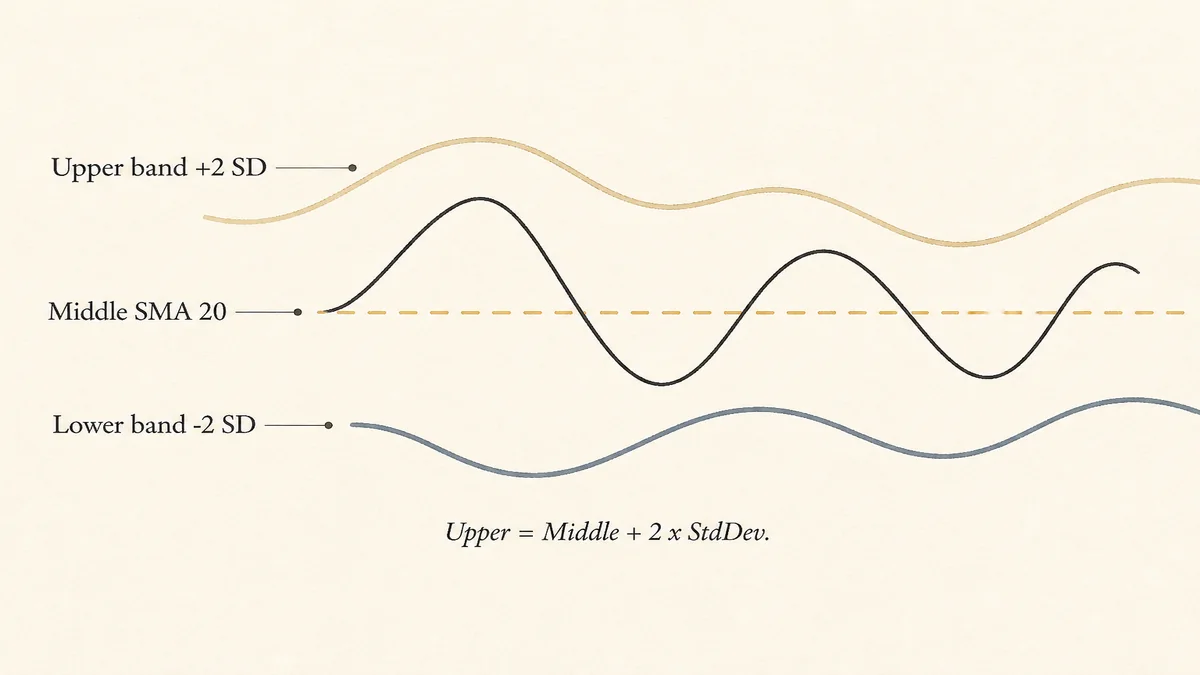
The default build is:
Middle = SMA(close, 20)
Upper  = Middle + 2 × StdDev(close, 20)
Lower  = Middle − 2 × StdDev(close, 20)
MetaTrader 5 uses a simple average in the middle line and standard deviation of closes. That matches Bollinger’s insistence on logical consistency: the same average family should sit in the middle band and in the deviation math.
Two derived reads do most of the work:
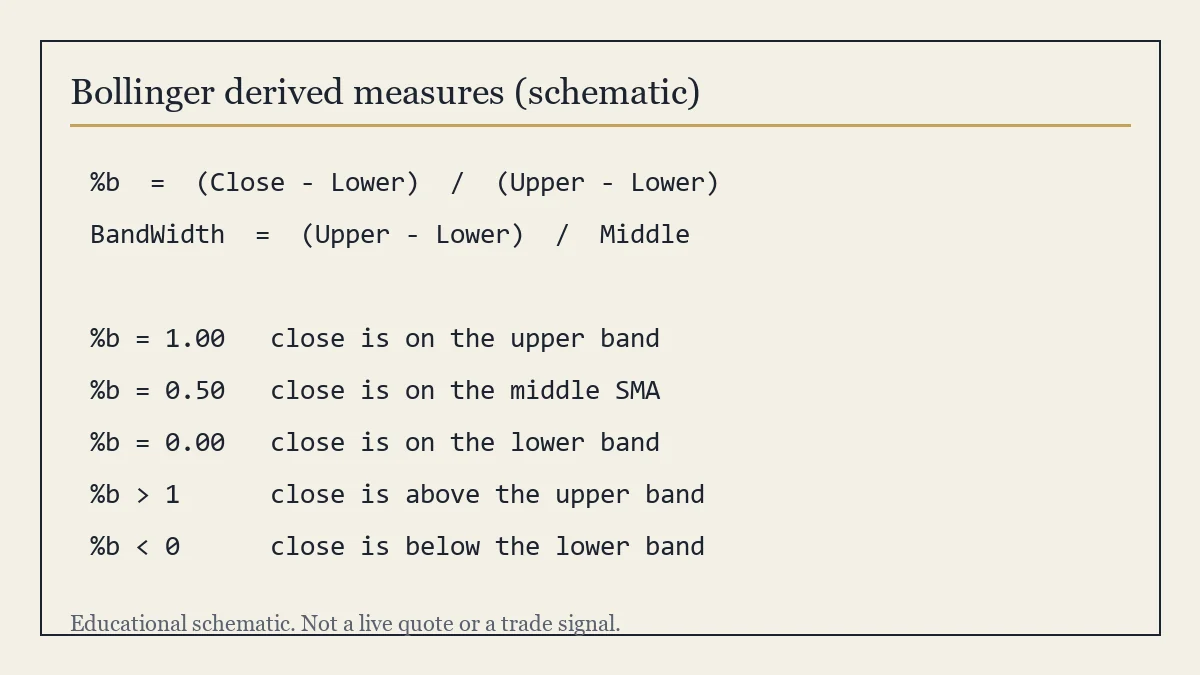
%b        = (Close − Lower) / (Upper − Lower)
BandWidth = (Upper − Lower) / Middle
%b locates the close inside (or outside) the envelope. BandWidth locates the squeeze.
For the broader indicator stack, see forex indicators explained and the beginner indicator path. Those pages survey tools. This page is the Bollinger working method.
What Bollinger Bands Actually Measure#
Short Answer
They measure how unusual the latest close is versus the last 20 closes, scaled by how jumpy those closes were.
Detailed Explanation
A moving average alone answers “where has price been.” Standard deviation answers “how widely has it been scattered.” Together they draw a channel that breathes. Quiet Asian hours often print a narrow envelope on M15 EUR/USD. The London open can widen the same envelope without any change in your settings. That is the point: the tool is adaptive. A 20-pip envelope on Monday is not a 20-pip envelope on NFP Friday.
Forex is an OTC market. The BIS Triennial Survey measures turnover across many venues, not one exchange tape. Your MT4/MT5 bands are computed on your broker’s OHLC. A slightly different feed can print a slightly different %b. That is not a bug in Bollinger Bands. It is the market structure you already accept when you trade a CFD.
Example
Two brokers, same clock, EUR/USD H1. Broker A’s close is 1.08512, Broker B’s is 1.08518. Both 20-period bands will be almost the same. A scalper using %b > 1.00 as an automatic fade can get a different yes/no on the two books. The professional response is to require a closed candle beyond structure, not a 0.02 difference in %b.
Common Mistake
Treating the middle band as a “support line” that must bounce. It is an average of the last 20 closes. Averages get pulled. They are not a bid.
Professional Tip
If you need a level, mark support and resistance first. Use the bands to ask how stretched price is at that level.
The 95% Myth — What the Math Does Not Promise#
Short Answer
Do not trade as if two standard deviations trap 95% of forex closes. That shortcut assumes a normal distribution and a large sample. Markets do not give you either.
Detailed Explanation
Introductory statistics says that for a normal variable, mean ± 2 standard deviations covers about 95.4% of observations. John Bollinger’s rule 14 tells you not to import that into price: the distribution of security prices is non-normal, and the typical lookback is too short for textbook significance. In practice he reports about 90%, not 95%, of data inside the default bands.
That 5-percentage-point gap is where fat-tail events live — the same events that stop out “fade the band” systems during CPI, FOMC and intervention spikes. The FCA’s CFD material and the CFTC’s Learn & Protect hub exist because leveraged products can move farther, faster, than a 20-candle window has “priced in.”
Example
Illustrative. If 90% of H1 closes sit inside the bands, 10% sit outside. Ten outside closes per 100 bars is not rare. A strategy that shorts every outside close is not harvesting a 95% edge. It is fading continuation — the opposite of Bollinger’s own outside-close rule.
Common Mistake
Copying “95% of price action stays inside the bands” from a generic indicator roundup into a live plan.
Professional Tip
Journal outside closes as regime information. Count how many of the last 20 were outside. A cluster of outside closes is a trend or a news regime, not a gift of mean reversion.
%b and BandWidth — The Two Numbers Worth Writing Down#
Short Answer
%b answers “where is the close.” BandWidth answers “how wide is the envelope.” Write both. Do not trade the picture of the lines alone.
Detailed Explanation
%b is a stochastic-style scaling of the close between the live bands. 1.00 is the upper band. 0.00 is the lower band. 0.50 is the middle SMA. Values above 1 or below 0 are outside closes. BandWidth divides the raw width by the middle band so a 150-yen USD/JPY envelope and a 0.0080 EUR/USD envelope can be compared as percentages rather than as apples to yen.
Bollinger lists the squeeze as BandWidth’s most popular use, and also notes that BandWidth can help mark trend changes when a rising width later rolls over. That second use is easy to overfit. Use it as a journal flag, not as a named “BandWidth reversal system.”
Example
Illustrative H1 gold. Middle = 2,640, upper = 2,668, lower = 2,612, close = 2,661. %b = (2,661 − 2,612) / (2,668 − 2,612) ≈ 0.88. Price is high in the envelope, not “must short.” BandWidth = 56 / 2,640 ≈ 2.1%. If last week’s BandWidth on the same chart was 1.1%, volatility has already expanded. Lot size that was acceptable last week is too large this week unless the stop is unchanged in dollars, not in dollars-of-band.
Common Mistake
Watching only whether price “hit the line.” Two hits at %b = 0.99 can be a walk. One hit at %b = 1.15 after a squeeze is a breakout test.
Professional Tip
Add %b and BandWidth as separate plots if your platform allows, or compute them once per setup in the journal. The lot calculator still needs a stop price. The bands help you choose a realistic distance; they do not replace the calculator.
Regime 1 — The Squeeze#
Short Answer
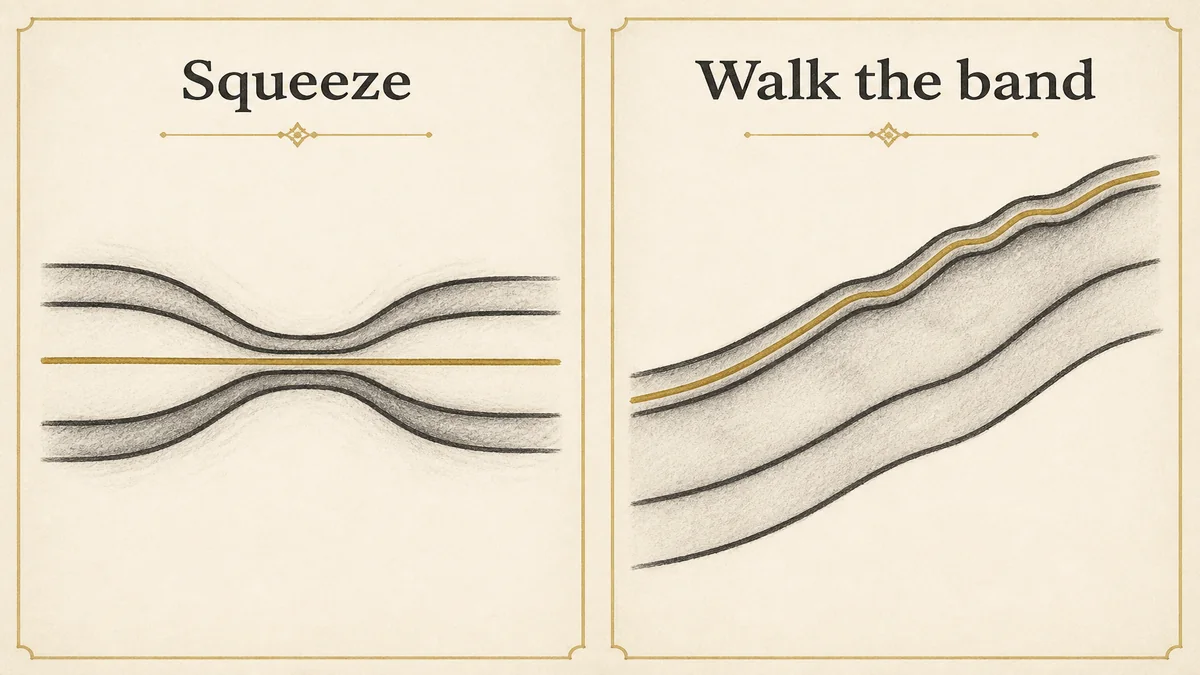
A squeeze is narrow BandWidth, not a direction. Plan for a larger range later. Do not guess which way the expansion prints.
Detailed Explanation
Volatility clusters. Quiet bars beget quiet bands. MetaTrader’s own notes say abrupt moves often follow a contracted band. That is a timing hint, not an arrow. In forex the squeeze often appears:
- Late in the New York afternoon into a quiet Asia session
- Into a well-flagged central-bank day, right before the statement
- Inside a well-worn range when both sides are waiting
The expansion that follows can be a trend day or a news spike that fails. The squeeze did not choose. Your job is to decide in advance whether you trade the first close outside (volatility breakout, continuation bias) or you wait for a retest after the expansion (see the false-breakout guide).
Example
Illustrative. GBP/USD M15 BandWidth falls to a two-week low during Tokyo. London opens, the first M15 candle closes above the upper band, and BandWidth jumps. A continuation plan would wait for that close, then a shallow pullback that holds the broken band or the range high. A fade plan would be betting against rule 8. Beginners should not run both plans on the same chart.
Common Mistake
Buying the squeeze itself because “a big move is coming.” The move can start with a stop-run through the opposite side.
Professional Tip
If you trade squeezes, pre-define invalidation on both sides. One working breakout. Not a straddle that turns into two losers when spread widens. Read when not to trade before treating every pre-NFP squeeze as a setup.
Regime 2 — Walking the Band#
Short Answer
In a trend, price can ride the upper or lower band. That is not a malfunction. It is rule 7.
Detailed Explanation
Mean reversion feels intuitive because bands look like rails. Rails in a trend are a moving ceiling the market keeps pushing. Each tag of the upper band can print a higher high. RSI will look “overbought” for hours. If you sell that, you are selling strength.
A walk is more believable when:
- Higher highs and higher lows (or the inverse) already exist on a higher timeframe
- The middle band is sloping with the walk, not flat
- Pullbacks hold near the middle band rather than slicing through to the opposite band
- Session liquidity supports the move (London–NY overlap on EUR, GBP and gold — see best time to trade)
This is the same regime idea as the trend / range / news playbook: the tool does not pick the strategy; the regime does.
Example
Illustrative USD/JPY H1. Upper band rising, closes repeatedly between %b 0.80 and 1.10, middle band rising, pullbacks stop around the middle band. A trend plan: buy a pullback that holds the middle band, stop beyond the last swing and beyond a volatility buffer, target a prior impulse or a trailing exit. A range plan: forbidden on this picture.
Common Mistake
Moving the stop to the middle band immediately so a normal pullback to the average stops you out of a still-valid walk.
Professional Tip
Trail using structure + ATR, not “opposite band.” The opposite band in a strong walk can be 2R away and still be the wrong place to take profit if your plan was a trend day. See trailing stops.
Regime 3 — Mean Reversion Inside a Range#
Short Answer
Fading a band only makes sense when you already have a range: two sides, multiple reactions, a flat middle band.
Detailed Explanation
Bollinger also uses bands to clarify W-bottoms and M-tops — pattern recognition, not a 24-hour fade. In a genuine range, a lower-band tag at support and an upper-band tag at resistance are location. You still need a trigger: a rejection wick, an engulfing close, a failure to hold outside. That is price action plus the envelope, not the envelope alone.
Mean reversion dies when the range is actually a coil before a squeeze expansion. If BandWidth is making new lows while you fade the edges, you may be fading the last quiet bars before the break.
Example
Illustrative EUR/USD H4. For two weeks price oscillates 1.0780–1.0860, middle band almost flat, BandWidth stable. A lower-band tag at 1.0784 with a close back above 1.0795 at the same place as a marked support zone is a complete story: zone + stretch + close. The same lower-band tag in the first hour of a US CPI release is not that story.
Common Mistake
Taking range fades on M5 because the bands look “the same” as on H4. Lower timeframes manufacture more tags. They do not manufacture more edge. See multi-timeframe analysis.
Professional Tip
Cap range trades at one attempt per edge. If the fade fails and price closes outside, you are no longer in regime 3. Switch to “stand aside” or to a breakout plan. Do not average.
How to Add the Indicator Without Fooling Yourself#
On MetaTrader: Insert → Indicators → Trend → Bollinger Bands. Period 20, deviation 2, apply to Close. Leave the middle as SMA unless you have a written reason to switch both the middle and the deviation math to exponential (Bollinger’s exponential note is all-or-nothing, not a mixed SMA/EMA hack).
Then add nothing else that repeats overbought/oversold. If you want a second tool, pick one that answers a different question: ATR for stop distance, a higher-timeframe bias line, or an economic calendar. The economic calendar reading guide stops you from treating a squeeze on NFP morning as a normal M15 pattern.
Worked Risk Math — Same Band, Different Lot#
Short Answer
When the envelope widens, lots shrink. The band is not a permission slip to keep 0.10 lots.
Detailed Explanation
Suppose a $5,000 account risks 1% = $50. Illustrative EUR/USD H1:
| State | Stop distance (pips) | Pip value at 0.10 lot | Lot that keeps $50 risk |
|---|---|---|---|
| Quiet squeeze | 18 | ~$1.00 | 0.28 (then round to what the broker allows) |
| Normal | 32 | ~$1.00 | 0.15 |
| Wide walk / news | 70 | ~$1.00 | 0.07 |
The 70-pip stop is not “worse trading.” It is the market’s current noise. Keeping 0.28 lots into the 70-pip state is how a volatility tool becomes a blow-up tool. Gold’s point value makes the same table more extreme — read how much capital to trade gold before copying EUR/USD lots onto XAU/USD.
Example
Illustrative. H1 gold ATR is $12, the lower band is $18 away from entry. You want the stop beyond the band and beyond a swing. Distance = $22. At $1 per 0.01 lot per $1 move on a typical 100 oz CFD, check your contract specification — do not use this paragraph as a live multiplier. The contract spec guide is the source of truth on the symbol you trade.
Common Mistake
Tightening the stop to keep the old lot size so the “1%” number still looks tidy while the stop now sits inside the band.
Professional Tip
If the correct lot rounds to below the broker minimum, skip the trade. That is a feature. See when the minimum lot is too big.
Combining Bands with Structure — A Repeatable Sequence#
Use this sequence on one pair, one working timeframe (H1 or H4 for most learners):
- Mark Daily bias in one line (up, down, range).
- Draw at most three zones.
- Read BandWidth (squeeze / normal / wide).
- Read %b of the last closed candle.
- Choose the matching plan: wait for expansion, walk pullback, or range fade.
- Write invalidation beyond structure, not on the band itself.
- Convert to lots at ≤1% cash risk.
- Check the calendar and the live spread.
That is the same four-part discipline as price action — bias, zone, trigger, invalidation — with the bands answering “how stretched” and “how quiet.” It is not a sixth indicator on the same idea.
Common Bollinger Mistakes in Forex#
Using bands as a standalone system. Bollinger says the bands do not provide continuous advice. They identify setups where the odds may be in your favour. Odds still need a stop, costs and a sample.
Fading outside closes. Continuation first.
Retuning 20,2 after a losing week. Defaults exist so you can judge the method. A 13-period, 1.8-deviation curve-fit will look genius until the next regime.
Applying M1 bands. Bollinger’s activity rule: bars must contain enough trading to describe price formation. A one-minute FX bar is often spread and noise.
Ignoring costs. A range fade with a 6-pip stop on a pair that can print a 1.5-pip spread around rollover is not a 1:2 plan. See all-in trading costs.
Copying stock-volume rules. Spot FX does not give you exchange volume. Tick volume is a count of price updates, not NYSE share volume. Do not require “volume confirmation” the way an equity breakout article does.
Checklist#
- Default 20,2 loaded on Close, SMA middle
- Regime named: squeeze, walk, or range
- %b and BandWidth written for the last closed candle
- Tag not treated as an order
- Outside close treated as continuation until structure fails
- Stop beyond structure plus a volatility buffer
- Lot size from cash risk, not from habit
- News window checked
- One pair, one working timeframe
- Journal screenshot includes the bands, the zone and the ticket
Next step: on a demo chart, label 30 closed H1 candles as squeeze, walk or range before looking at P&L. Then size with the 1% rule examples. Broker choice does not replace that drill. Country and entity still decide whether a platform is available — XM availability is not an edge.
Glossary#
- Bollinger Bands — A 20-period SMA with upper and lower bands at a chosen number of standard deviations (default 2).
- Tag — Price touching a band. Information, not a signal.
- Walk — A sequence of closes that ride the upper or lower band in a trend.
- Squeeze — Unusually narrow BandWidth; compressed volatility.
- %b — Location of the close in the envelope, 0 at the lower band, 1 at the upper band.
- BandWidth — Envelope width divided by the middle band.
- Outside close — Close above the upper band or below the lower band; continuation first.
- Envelope — The region between upper and lower bands.
Related Reading#
- False breakout forex guide
- ATR stop-loss guide
- Forex indicators explained
- Market-regime playbook
- Support and resistance
- Price action framework
- Technical analysis pillar
Suggested Future Articles#
- Bollinger %b divergence versus price: a journal template, not a signal service
- Session-specific BandWidth: Asia squeeze versus London expansion on EUR/USD
- Why EMA-based “Bollinger” clones change the squeeze timing
Risk warning: CFDs are complex leveraged products. A majority of retail client accounts lose money. Hypothetical band levels are educational. Confirm contract specifications with your broker and read the ForexTradeLab disclaimer.
Comments
Add a useful note for other traders. We review comments before publishing.