
- Support and resistance are zones, not exact lines — price reacts to areas where buying or selling previously clustered
- A level becomes more significant the more times it is tested and the more volume/attention it has attracted
- Levels do not 'cause' reversals; they mark where order flow has historically shifted, and they can break
- The three core ways to trade levels are bounces (range), breakouts, and breakout-retests — each suits different market conditions
- Confirmation and risk management matter more than the level itself; every level eventually fails
- What Support and Resistance Actually Are
- Short Answer
- Detailed Explanation
- Example
- Common Mistake
- Professional Tip
- Why You Should Draw Zones, Not Thin Lines
- How to Identify High-Quality Levels
- The Role Reversal Principle
- Three Ways to Trade Support and Resistance
- 1. The Bounce (Range Trading)
- 2. The Breakout
- 3. The Breakout-Retest (Often the Cleanest)
- Combining Levels With Risk Management
- Common Mistakes
Affiliate disclosure: ForexTradeLab may earn a commission from partner broker links, at no added cost to you. Read our affiliate disclosure.
What Support and Resistance Actually Are#
Short Answer
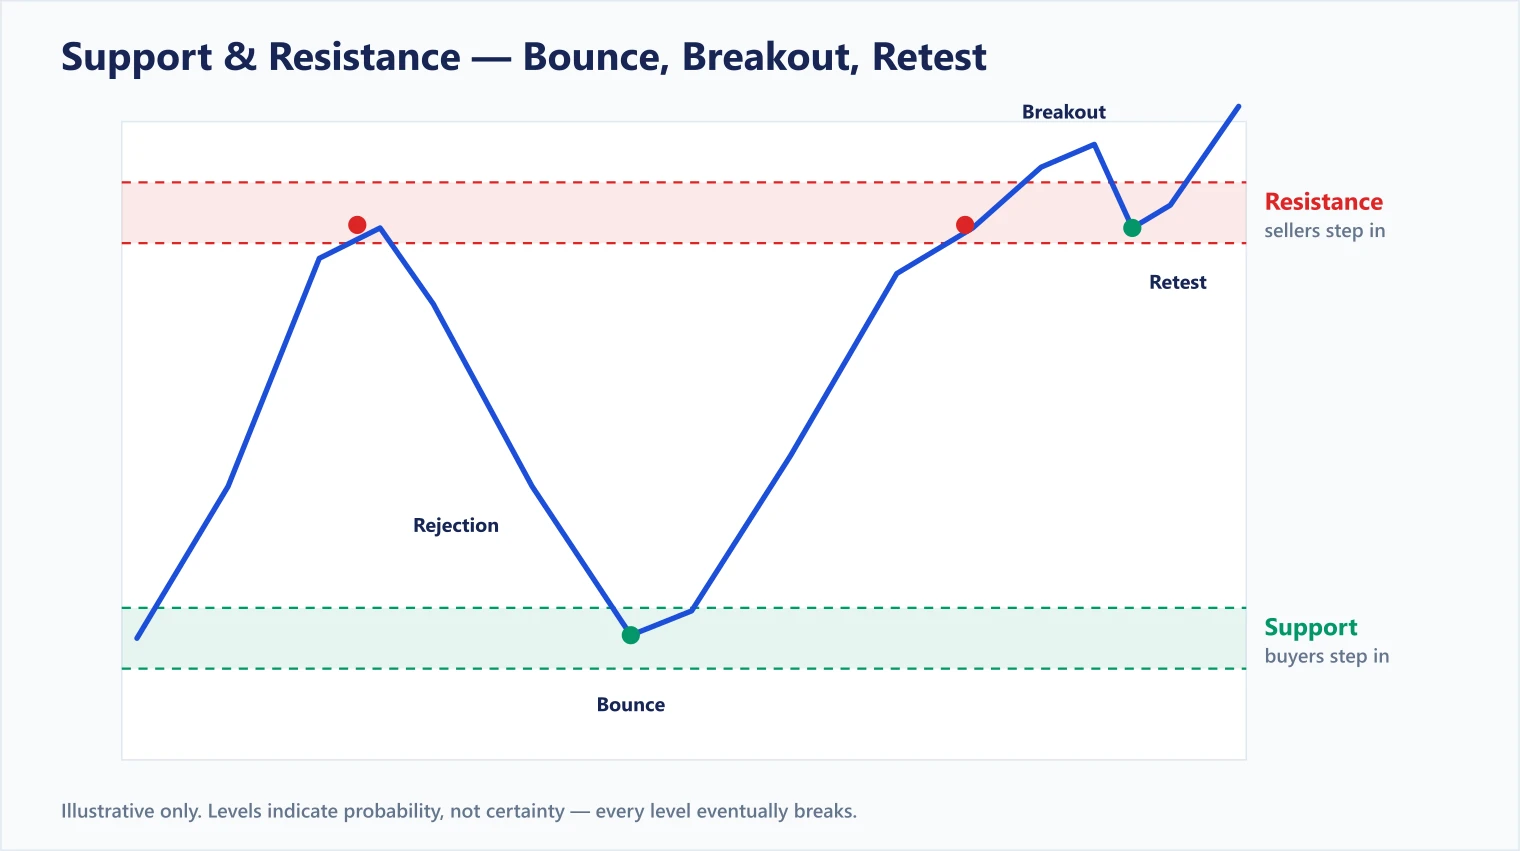
Support is a price zone where buying has previously overwhelmed selling and price tends to stop falling; resistance is where selling has overwhelmed buying and price tends to stop rising. Identify them by marking areas where price reversed or paused multiple times on higher timeframes. Trade them three ways: buy near support / sell near resistance in a range, trade the breakout when a level gives way on momentum, or wait for a breakout then a retest of the level for a lower-risk entry. Treat every level as a zone, use confirmation, and always place a stop because any level can break.
Detailed Explanation
These zones summarise prior reactions; they do not prove that unfilled institutional orders remain or that price will reverse again. Define the zone, entry trigger and invalidation before the outcome, then test those rules by pair and timeframe with realistic costs.
Example
If EUR/USD repeatedly turns within 1.0790–1.0810, mark the band rather than 1.0800 alone. A later close and retest above the band may qualify under a written breakout rule, but it can still fail.
Common Mistake
Moving a zone after the trade so every historical turn appears to validate the method.
Professional Tip
Timestamp zones before price returns and journal every valid signal, including failures, to reduce hindsight bias.
Support is a price area where falling prices have historically met enough buying to pause or reverse. Resistance is an area where rising prices have met enough selling to stall or turn down. Think of them as zones of memory — places where traders previously made decisions, and tend to again.
A useful mental model: support and resistance are not magic lines that "push" price around. They are records of where order flow shifted. Buyers who missed a move want a second chance; sellers who got trapped want to exit at breakeven; algorithms cluster orders at obvious levels. All of that activity concentrates around the same zones — which is why the levels often matter, and also why they eventually fail when that supply or demand is exhausted.
This article is educational only — not investment advice or a promise of results. Markets are probabilistic; no level guarantees a reaction.
Why You Should Draw Zones, Not Thin Lines#
The most common beginner mistake is drawing a single hairline at an exact price and expecting price to respect it to the pip. Real markets are messier. Wicks overshoot, spreads vary, and different traders watch slightly different prices.
Mark support and resistance as bands (a small range) rather than lines. This:
- Stops you from acting on a 1-pip "break" that is just noise.
- Reflects how price genuinely behaves around old turning points.
- Gives your stop loss a logical buffer beyond the zone.
This zone-based thinking is closely related to supply and demand trading — for the order-flow lens on the same idea, see our supply and demand zones guide.
How to Identify High-Quality Levels#
Not all levels are equal. Prioritise those with more confluence and history:
| Factor | Why it strengthens a level |
|---|---|
| Multiple touches | The more times price reacted there, the more traders watch it |
| Higher timeframe | A daily/weekly level outranks a 5-minute level |
| Sharp reversal | A strong, fast rejection signals heavy order flow |
| Round numbers | 1.1000, 150.00 etc. attract clustered orders psychologically |
| Prior breakout | Old resistance often becomes new support (and vice versa) |
The Role Reversal Principle#
When resistance breaks, it frequently becomes support on the way back down — and vice versa. This "polarity flip" happens because traders who watched the level switch their bias once it gives way. It is one of the most reliable behaviours to watch for, and it sets up the retest entry described below.
To place levels in the wider analytical picture, pair this with our technical analysis overview and candlestick basics guide.
Three Ways to Trade Support and Resistance#
1. The Bounce (Range Trading)#
In a sideways market, price oscillates between support and resistance. The idea: buy near support, sell near resistance.
- Wait for confirmation — a rejection wick, bullish/bearish candle, or momentum stalling — rather than buying blindly into the zone.
- Stop goes just beyond the zone (so a genuine break takes you out small).
- Target the opposite side of the range.
Range trading fails when the range breaks, so keep risk tight and never assume the boundary will hold forever.
2. The Breakout#
When price pushes through a level with conviction, it can signal the start of a new trend. The challenge is false breakouts — price pokes through, traps breakout buyers, then snaps back.
To filter:
- Favour breakouts with a strong, decisive candle and ideally rising participation.
- Be cautious around low-liquidity hours when fakeouts are common — see forex market hours and liquidity.
- Avoid chasing far past the level; the further you enter, the worse your risk-reward.
3. The Breakout-Retest (Often the Cleanest)#
A patient compromise: wait for the breakout, then wait for price to return and retest the broken level (now flipped support/resistance). If it holds, you enter in the breakout direction with:
- A tight, logical stop just beyond the retested zone.
- A clear invalidation (if the level fails, you're wrong quickly and cheaply).
- Better risk-reward than chasing the initial breakout.
The trade-off: not every breakout retests, so you will miss some moves. That is the cost of waiting for a higher-probability entry.
Combining Levels With Risk Management#
A level is only half a trade. The other half is what you risk to find out if you're right. No matter how clean the zone looks:
- Define your stop before entering, just beyond the zone.
- Size the position so that stop equals 1–2% of your account.
- Set a take profit at the next opposing level or a defined risk-reward multiple.
For the complete framework, read our stop loss and take profit guide and risk management guide. The discipline matters more than the drawing — every level eventually breaks, and survival depends on small, controlled losses when it does.
Common Mistakes#
- Forcing levels onto every minor wiggle instead of marking only obvious, repeatedly-tested zones.
- Drawing on low timeframes only, ignoring the dominant higher-timeframe structure.
- Treating levels as certainties rather than zones of higher probability.
- No stop, because "the level will surely hold."
- Trading against a strong trend by fading every resistance in a powerful uptrend.
Practice on live charts: Open a free XM account — regulated broker, $5 minimum deposit, and full MT4/MT5 charting so you can mark zones and test bounce, breakout and retest entries risk-free on a demo.
Risk warning: Forex and CFD trading carries a high risk of loss, and most retail traders lose money. Support and resistance indicate probability, not certainty — any level can break, and price can slip or gap past your stop in fast markets. Leverage magnifies losses. Trade only capital you can afford to lose and test methods on a demo first.
Comments 1
I liked the rule-based framing for Support and Resistance in Forex. It gives enough structure to journal the setup instead of judging every trade by the final profit or loss.
Add a useful note for other traders. We review comments before publishing.