- Every currency trade is long one currency and short the other
- BIS April 2025 shares: dollar 89.2%, euro 28.9%, yen 16.8%, sterling 10.2%; shares sum to 200%
- Several USD pairs are one dollar view, which is concentration rather than diversification
- Turnover rank does not choose the pair; spread, session and stop distance do
- Currency pairs: direct answer
- Which currencies actually trade
- Introduction
- What a Currency Pair Actually Quotes
- Bid, Ask, and the Price You Can Trade
- Major Pairs and Their Economic Drivers
- Cross Pairs: Two Stories Without the Dollar
- Exotic Pairs and Why Costs Matter More
- Pips, Points, and Pip Value
- Sessions, Liquidity, and Market Timing
- Correlation Is Exposure, Not Diversification
- Building a Watchlist That Teaches You
- A Position-Sizing Framework for Any Pair
- Pre-Trade Checklist
- Conclusion
Currency pairs: direct answer#
Short Answer
A currency pair states the value of one currency in another; every trade is simultaneously long one and short the other.
Detailed Explanation
The base currency appears first and the quote currency second. Pair selection changes drivers, spread, pip value and hidden portfolio correlation.
Example
Buying EUR/USD at 1.1000 means buying euros against dollars at roughly USD 1.10 per euro before trading costs.
Common Mistake
Calling several USD positions diversified when they all depend on the same dollar move.
Professional Tip
Write “long base, short quote,” calculate pip value and check correlated exposure before entry.
Which currencies actually trade#
Short Answer
In the April 2025 BIS survey, the US dollar was on one side of 89.2% of OTC FX trades, the euro 28.9%, the yen 16.8%, sterling 10.2%, the renminbi 8.5% and the Swiss franc 6.4%. Shares sum to 200% because every trade has two currencies.
Detailed Explanation
The dollar’s share rose from 88.4% in 2022. The euro fell from 30.6%, and sterling fell from 12.9%, while the renminbi and the Swiss franc rose. Those ranks describe turnover in one month, April 2025, across spot, forwards, swaps and options. They are the best official map of where liquidity concentrates. They are silent on whether EUR/USD will rise next week.
The map still changes how a watchlist should be built. A set of “different” majors that all include the dollar is one dollar view several times. That follows from the 89.2% share; it is the same point as the correlation warning below, with a measured source. Sterling’s smaller share is a liquidity fact from the survey. It is a weak reason to sell GBP/USD. The renminbi’s rise to 8.5% records a larger role in global dealing, and a retail exotic or CNY contract can still carry wide spreads, different trading hours and local restrictions. Instrument mix belongs with the headline: FX swaps were about 42% of the $9.6 trillion average daily turnover, and spot about 31%. Full market context is in what forex is.
Example
Long EUR/USD and long GBP/USD is long two base currencies and short the dollar twice. If the dollar rallies on a Federal Reserve surprise, both tickets can lose together. Two confirmations on the chart are one macro exposure.
Common Mistake
Ranking pairs by BIS share and then calling the top of the list the “best” pair to trade. Share measures who already deals. Your spread, session and stop distance decide whether the pair fits the account.
Professional Tip
Put the BIS rank in the watchlist notes, then write the live spread and the pip value beside it. Liquidity in April 2025 does not price this morning’s quote.
Introduction#
Short Answer
A currency pair is not a standalone asset. It is a relative price: the value of one currency expressed in another. That apparently simple fact explains why a trade can be affected by two central banks, two inflation paths, two political systems, and global risk appetite at the same time.
What a Currency Pair Actually Quotes#
Short Answer
EUR/USD at 1.1000 says that one euro is worth 1.10 US dollars. EUR is the base currency and USD is the quote currency. Buying the pair means buying euros and selling dollars together; selling it reverses that exposure. A quotation is therefore a comparison, not a prediction that one country is universally strong or weak.
Detailed Explanation
EUR/USD at 1.1000 says that one euro is worth 1.10 US dollars. EUR is the base currency and USD is the quote currency. Buying the pair means buying euros and selling dollars together; selling it reverses that exposure. A quotation is therefore a comparison, not a prediction that one country is universally strong or weak. If EUR/USD moves from 1.1000 to 1.1050, the euro has gained five US cents per euro against the dollar. That move can arise from stronger euro-area data, weaker US data, changing rate expectations, or a change in risk appetite. The chart alone does not identify the cause.
Example
If EUR/USD moves from 1.1000 to 1.1050, the euro has gained five US cents per euro against the dollar. That move can arise from stronger euro-area data, weaker US data, changing rate expectations, or a change in risk appetite. The chart alone does not identify the cause.
Bid, Ask, and the Price You Can Trade#
Short Answer
A platform normally shows a bid and an ask. You sell at the bid and buy at the ask. Their difference is the spread, an immediate cost that changes with liquidity, volatility, the broker's pricing model, and the time of day. A chart may display a mid-price, which is not necessarily the price at which an order can be filled.
Detailed Explanation
A platform normally shows a bid and an ask. You sell at the bid and buy at the ask. Their difference is the spread, an immediate cost that changes with liquidity, volatility, the broker's pricing model, and the time of day. A chart may display a mid-price, which is not necessarily the price at which an order can be filled. Suppose EUR/USD is quoted 1.10000 bid and 1.10012 ask. A new buy begins twelve points behind the bid before commission, financing, or slippage. Treat an advertised minimum spread as a marketing snapshot, not as a promise for every trading condition.
Example
Suppose EUR/USD is quoted 1.10000 bid and 1.10012 ask. A new buy begins twelve points behind the bid before commission, financing, or slippage. Treat an advertised minimum spread as a marketing snapshot, not as a promise for every trading condition.
Major Pairs and Their Economic Drivers#
Short Answer
Major pairs combine the US dollar with another heavily traded currency. EUR/USD, GBP/USD, USD/JPY, USD/CHF, AUD/USD, USD/CAD, and NZD/USD are commonly described as majors. They often have deeper normal liquidity than other retail symbols, but major does not mean calm, guaranteed, or appropriate for every strategy.
Detailed Explanation
Major pairs combine the US dollar with another heavily traded currency. EUR/USD, GBP/USD, USD/JPY, USD/CHF, AUD/USD, USD/CAD, and NZD/USD are commonly described as majors. They often have deeper normal liquidity than other retail symbols, but major does not mean calm, guaranteed, or appropriate for every strategy. EUR/USD can react to the ECB, the Federal Reserve, inflation, growth, and risk sentiment. USD/JPY can respond to US yields, Bank of Japan policy, and changing appetite for risk. USD/CAD can also react to Canadian economic releases and oil-market developments. A trader needs an economic map, not a nickname.
Example
EUR/USD can react to the ECB, the Federal Reserve, inflation, growth, and risk sentiment. USD/JPY can respond to US yields, Bank of Japan policy, and changing appetite for risk. USD/CAD can also react to Canadian economic releases and oil-market developments. A trader needs an economic map, not a nickname.
Cross Pairs: Two Stories Without the Dollar#
Short Answer
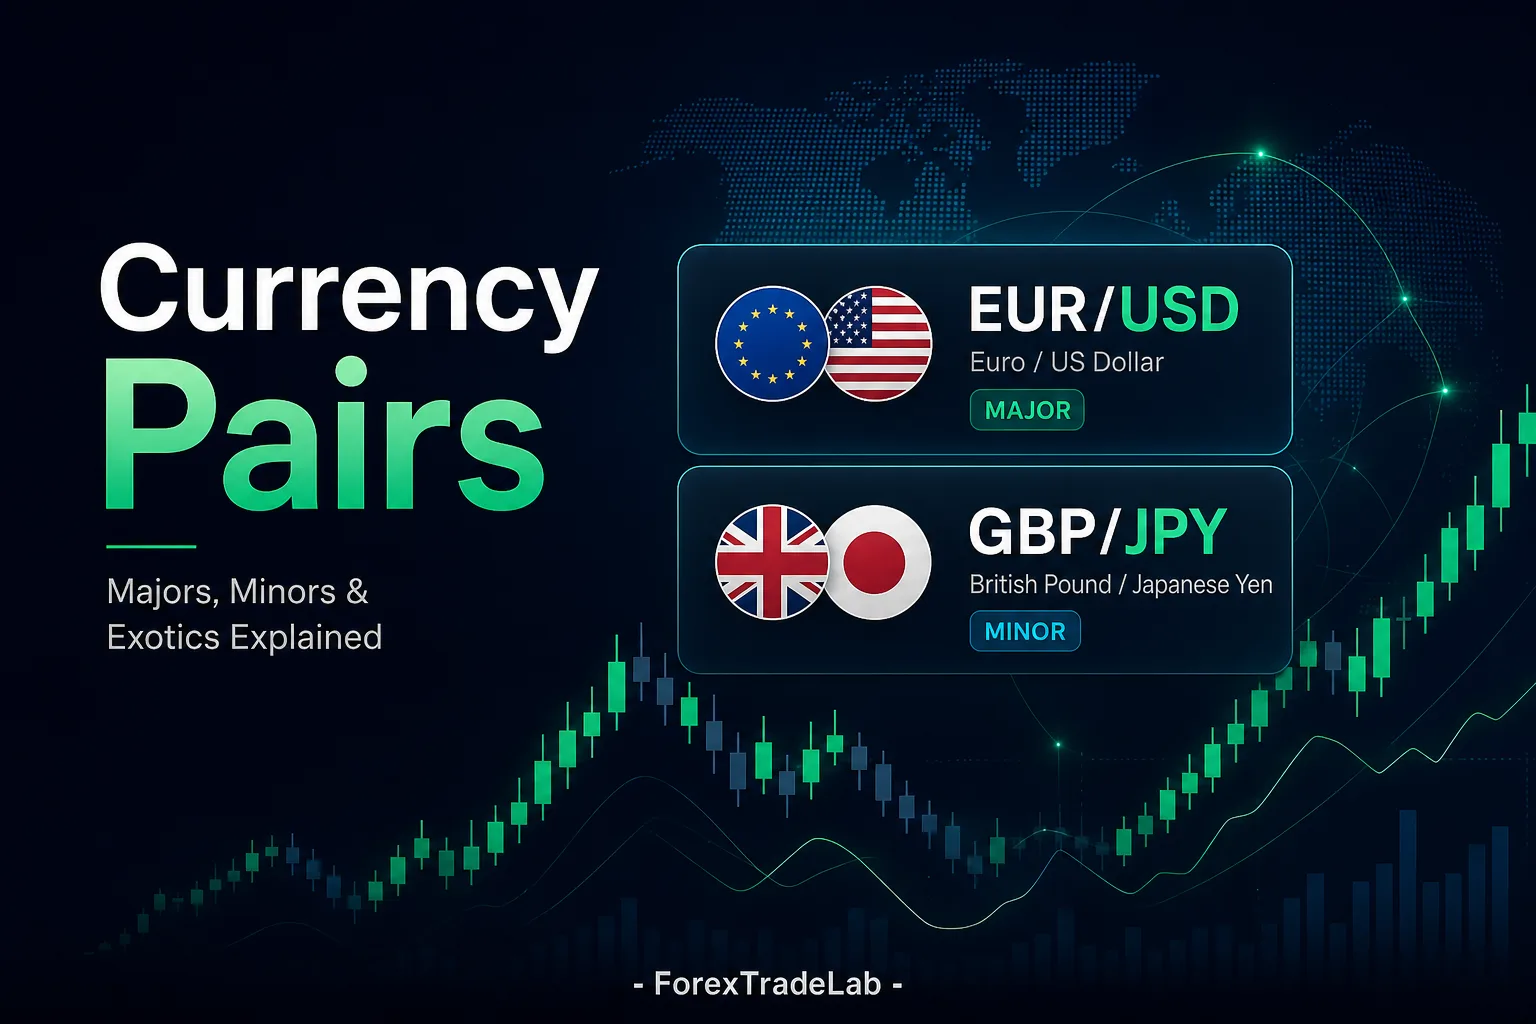
A cross, sometimes called a minor pair, omits the US dollar. EUR/GBP, EUR/JPY, GBP/JPY, AUD/JPY, and EUR/CHF are examples. Crosses often express a cleaner relative view between two economies, yet their pricing can still be influenced by broad dollar moves through the underlying major-pair market.
Detailed Explanation
A cross, sometimes called a minor pair, omits the US dollar. EUR/GBP, EUR/JPY, GBP/JPY, AUD/JPY, and EUR/CHF are examples. Crosses often express a cleaner relative view between two economies, yet their pricing can still be influenced by broad dollar moves through the underlying major-pair market. EUR/GBP may rise when the euro outlook improves relative to the United Kingdom, even if both currencies are declining against the dollar. GBP/JPY combines a currency often sensitive to UK data with one affected by Japanese policy and global risk positioning; its larger daily range can make a careless position size dangerous.
Example
EUR/GBP may rise when the euro outlook improves relative to the United Kingdom, even if both currencies are declining against the dollar. GBP/JPY combines a currency often sensitive to UK data with one affected by Japanese policy and global risk positioning; its larger daily range can make a careless position size dangerous.
Exotic Pairs and Why Costs Matter More#
Short Answer
Exotic pairs join a widely traded currency with a less-traded or emerging-market currency. USD/TRY, USD/ZAR, USD/MXN, and EUR/TRY are examples, though classification varies by provider. They can have wider spreads, thinner liquidity, larger overnight financing charges, abrupt gaps, and material policy or capital-control risk.
Detailed Explanation
Exotic pairs join a widely traded currency with a less-traded or emerging-market currency. USD/TRY, USD/ZAR, USD/MXN, and EUR/TRY are examples, though classification varies by provider. They can have wider spreads, thinner liquidity, larger overnight financing charges, abrupt gaps, and material policy or capital-control risk. A low-looking margin requirement does not offset a spread that consumes a meaningful part of the planned stop distance. Before considering an exotic pair, inspect normal and stressed spreads, contract size, pip convention, overnight financing, economic-calendar risk, and whether your broker can reliably execute its listed conditions.
Example
A low-looking margin requirement does not offset a spread that consumes a meaningful part of the planned stop distance. Before considering an exotic pair, inspect normal and stressed spreads, contract size, pip convention, overnight financing, economic-calendar risk, and whether your broker can reliably execute its listed conditions.
Pips, Points, and Pip Value#
Short Answer
For many non-JPY pairs, a pip is conventionally the fourth decimal place; for JPY pairs, it is conventionally the second. Brokers may quote an extra fractional digit. Pip value depends on the position size, pair, current exchange rate, and account currency. It is not safe to assume that every pair has the same dollar value per pip.
Detailed Explanation
For many non-JPY pairs, a pip is conventionally the fourth decimal place; for JPY pairs, it is conventionally the second. Brokers may quote an extra fractional digit. Pip value depends on the position size, pair, current exchange rate, and account currency. It is not safe to assume that every pair has the same dollar value per pip. A standard 100,000-unit EUR/USD position has an approximate US-dollar pip value of ten dollars when USD is the account currency. A similar-sized EUR/GBP position has a pip value in pounds before conversion. Use a pip-value calculator and calculate the cash loss at the stop before entering.
Example
A standard 100,000-unit EUR/USD position has an approximate US-dollar pip value of ten dollars when USD is the account currency. A similar-sized EUR/GBP position has a pip value in pounds before conversion. Use a pip-value calculator and calculate the cash loss at the stop before entering.
Sessions, Liquidity, and Market Timing#
Short Answer
Forex activity moves through Asian, European, and North American dealing hours. The overlap between active centres often produces more quoted liquidity in the most traded pairs, while holidays, rollovers, and the period around the weekly close can create wider spreads. Daylight-saving changes mean platform times need regular checking.
Detailed Explanation
Forex activity moves through Asian, European, and North American dealing hours. The overlap between active centres often produces more quoted liquidity in the most traded pairs, while holidays, rollovers, and the period around the weekly close can create wider spreads. Daylight-saving changes mean platform times need regular checking. EUR/USD may be most actively discussed during London and New York hours, but a European data release can cause sharp movement when liquidity is present. AUD/USD may react to Australian or Chinese developments outside a European trader's daytime. A suitable pair should match the hours in which you can monitor it calmly.
Example
EUR/USD may be most actively discussed during London and New York hours, but a European data release can cause sharp movement when liquidity is present. AUD/USD may react to Australian or Chinese developments outside a European trader's daytime. A suitable pair should match the hours in which you can monitor it calmly.
Correlation Is Exposure, Not Diversification#
Short Answer
Correlation describes how two returns have moved together over a chosen historical window. It is not a fixed law and can change suddenly. Long EUR/USD and long GBP/USD commonly create two positions that are both sensitive to broad US-dollar weakness; calling that diversification can conceal a concentrated trade.
Detailed Explanation
Correlation describes how two returns have moved together over a chosen historical window. It is not a fixed law and can change suddenly. Long EUR/USD and long GBP/USD commonly create two positions that are both sensitive to broad US-dollar weakness; calling that diversification can conceal a concentrated trade. A correlation coefficient near +1 indicates that two series tended to move together in the period measured, while a value near -1 indicates opposite movement. The number does not predict tomorrow. Use it as an exposure review, then ask which currency is being bought or sold across the complete portfolio.
Example
A correlation coefficient near +1 indicates that two series tended to move together in the period measured, while a value near -1 indicates opposite movement. The number does not predict tomorrow. Use it as an exposure review, then ask which currency is being bought or sold across the complete portfolio.
Building a Watchlist That Teaches You#
Short Answer
A short watchlist encourages depth. Many new traders begin by observing EUR/USD and one additional pair with a different rhythm, recording its average range, scheduled releases, normal spread, and reaction to surprises. This is more useful than scanning dozens of symbols for a late entry.
Detailed Explanation
A short watchlist encourages depth. Many new traders begin by observing EUR/USD and one additional pair with a different rhythm, recording its average range, scheduled releases, normal spread, and reaction to surprises. This is more useful than scanning dozens of symbols for a late entry. For each chosen pair, write a one-line exposure statement, list the two relevant central banks, and note the releases that matter. Link this work to a forex economic calendar and your trading journal, rather than treating pair selection as a one-time decision.
Example
For each chosen pair, write a one-line exposure statement, list the two relevant central banks, and note the releases that matter. Link this work to a forex economic calendar and your trading journal, rather than treating pair selection as a one-time decision.
A Position-Sizing Framework for Any Pair#
Short Answer
Risk is the cash amount lost if a stop is reached, not the number of lots selected because a platform permits them. A practical sequence is: choose the maximum cash loss, determine a technically justified stop distance, calculate pip value, then derive the smallest appropriate volume. If the required volume is unavailable, do not force the trade.
Detailed Explanation
Risk is the cash amount lost if a stop is reached, not the number of lots selected because a platform permits them. A practical sequence is: choose the maximum cash loss, determine a technically justified stop distance, calculate pip value, then derive the smallest appropriate volume. If the required volume is unavailable, do not force the trade. For a 200-dollar account and a two-dollar risk limit, a 40-pip stop allows five cents per pip before costs. If the minimum trade size creates a larger loss, the account or instrument does not fit the plan. Read the complete risk-management guide before increasing leverage.
Example
For a 200-dollar account and a two-dollar risk limit, a 40-pip stop allows five cents per pip before costs. If the minimum trade size creates a larger loss, the account or instrument does not fit the plan. Read the complete risk-management guide before increasing leverage.
Pre-Trade Checklist#
- Understand the product, legal entity, and its terms.
- Define the maximum cash loss before entry.
- Check spread, commission, financing, and possible slippage.
- Review total exposure and correlations.
- Accept that no trade is a valid decision when conditions are absent.
Conclusion#
Disciplined understanding of mechanics, costs, and risk matters more than any promise of quick returns. Use this guide as a starting point, verify official terms, and keep cash limits that you can actually follow.
Further Perspective: What a Currency Pair Actually Quotes#
EUR/USD at 1.1000 says that one euro is worth 1.10 US dollars. EUR is the base currency and USD is the quote currency. Buying the pair means buying euros and selling dollars together; selling it reverses that exposure. A quotation is therefore a comparison, not a prediction that one country is universally strong or weak. If EUR/USD moves from 1.1000 to 1.1050, the euro has gained five US cents per euro against the dollar. That move can arise from stronger euro-area data, weaker US data, changing rate expectations, or a change in risk appetite. The chart alone does not identify the cause. Do not treat this as a universal rule detached from your circumstances; connect it to account size, costs, broker terms, and the risk plan. Calm comparison of scenarios before execution protects against impulsive decisions.
Further Perspective: Bid, Ask, and the Price You Can Trade#
A platform normally shows a bid and an ask. You sell at the bid and buy at the ask. Their difference is the spread, an immediate cost that changes with liquidity, volatility, the broker's pricing model, and the time of day. A chart may display a mid-price, which is not necessarily the price at which an order can be filled. Suppose EUR/USD is quoted 1.10000 bid and 1.10012 ask. A new buy begins twelve points behind the bid before commission, financing, or slippage. Treat an advertised minimum spread as a marketing snapshot, not as a promise for every trading condition. Do not treat this as a universal rule detached from your circumstances; connect it to account size, costs, broker terms, and the risk plan. Calm comparison of scenarios before execution protects against impulsive decisions.
Further Perspective: Major Pairs and Their Economic Drivers#
Major pairs combine the US dollar with another heavily traded currency. EUR/USD, GBP/USD, USD/JPY, USD/CHF, AUD/USD, USD/CAD, and NZD/USD are commonly described as majors. They often have deeper normal liquidity than other retail symbols, but major does not mean calm, guaranteed, or appropriate for every strategy. EUR/USD can react to the ECB, the Federal Reserve, inflation, growth, and risk sentiment. USD/JPY can respond to US yields, Bank of Japan policy, and changing appetite for risk. USD/CAD can also react to Canadian economic releases and oil-market developments. A trader needs an economic map, not a nickname. Do not treat this as a universal rule detached from your circumstances; connect it to account size, costs, broker terms, and the risk plan. Calm comparison of scenarios before execution protects against impulsive decisions.
Further Perspective: Cross Pairs: Two Stories Without the Dollar#
A cross, sometimes called a minor pair, omits the US dollar. EUR/GBP, EUR/JPY, GBP/JPY, AUD/JPY, and EUR/CHF are examples. Crosses often express a cleaner relative view between two economies, yet their pricing can still be influenced by broad dollar moves through the underlying major-pair market. EUR/GBP may rise when the euro outlook improves relative to the United Kingdom, even if both currencies are declining against the dollar. GBP/JPY combines a currency often sensitive to UK data with one affected by Japanese policy and global risk positioning; its larger daily range can make a careless position size dangerous. Do not treat this as a universal rule detached from your circumstances; connect it to account size, costs, broker terms, and the risk plan. Calm comparison of scenarios before execution protects against impulsive decisions.
Further Perspective: Exotic Pairs and Why Costs Matter More#
Exotic pairs join a widely traded currency with a less-traded or emerging-market currency. USD/TRY, USD/ZAR, USD/MXN, and EUR/TRY are examples, though classification varies by provider. They can have wider spreads, thinner liquidity, larger overnight financing charges, abrupt gaps, and material policy or capital-control risk. A low-looking margin requirement does not offset a spread that consumes a meaningful part of the planned stop distance. Before considering an exotic pair, inspect normal and stressed spreads, contract size, pip convention, overnight financing, economic-calendar risk, and whether your broker can reliably execute its listed conditions. Do not treat this as a universal rule detached from your circumstances; connect it to account size, costs, broker terms, and the risk plan. Calm comparison of scenarios before execution protects against impulsive decisions.
Further Perspective: Pips, Points, and Pip Value#
For many non-JPY pairs, a pip is conventionally the fourth decimal place; for JPY pairs, it is conventionally the second. Brokers may quote an extra fractional digit. Pip value depends on the position size, pair, current exchange rate, and account currency. It is not safe to assume that every pair has the same dollar value per pip. A standard 100,000-unit EUR/USD position has an approximate US-dollar pip value of ten dollars when USD is the account currency. A similar-sized EUR/GBP position has a pip value in pounds before conversion. Use a pip-value calculator and calculate the cash loss at the stop before entering. Do not treat this as a universal rule detached from your circumstances; connect it to account size, costs, broker terms, and the risk plan. Calm comparison of scenarios before execution protects against impulsive decisions.
Further Perspective: Sessions, Liquidity, and Market Timing#
Forex activity moves through Asian, European, and North American dealing hours. The overlap between active centres often produces more quoted liquidity in the most traded pairs, while holidays, rollovers, and the period around the weekly close can create wider spreads. Daylight-saving changes mean platform times need regular checking. EUR/USD may be most actively discussed during London and New York hours, but a European data release can cause sharp movement when liquidity is present. AUD/USD may react to Australian or Chinese developments outside a European trader's daytime. A suitable pair should match the hours in which you can monitor it calmly. Do not treat this as a universal rule detached from your circumstances; connect it to account size, costs, broker terms, and the risk plan. Calm comparison of scenarios before execution protects against impulsive decisions.
Further Perspective: Correlation Is Exposure, Not Diversification#
Correlation describes how two returns have moved together over a chosen historical window. It is not a fixed law and can change suddenly. Long EUR/USD and long GBP/USD commonly create two positions that are both sensitive to broad US-dollar weakness; calling that diversification can conceal a concentrated trade. A correlation coefficient near +1 indicates that two series tended to move together in the period measured, while a value near -1 indicates opposite movement. The number does not predict tomorrow. Use it as an exposure review, then ask which currency is being bought or sold across the complete portfolio. Do not treat this as a universal rule detached from your circumstances; connect it to account size, costs, broker terms, and the risk plan. Calm comparison of scenarios before execution protects against impulsive decisions.
Further Perspective: Building a Watchlist That Teaches You#
A short watchlist encourages depth. Many new traders begin by observing EUR/USD and one additional pair with a different rhythm, recording its average range, scheduled releases, normal spread, and reaction to surprises. This is more useful than scanning dozens of symbols for a late entry. For each chosen pair, write a one-line exposure statement, list the two relevant central banks, and note the releases that matter. Link this work to a forex economic calendar and your trading journal, rather than treating pair selection as a one-time decision. Do not treat this as a universal rule detached from your circumstances; connect it to account size, costs, broker terms, and the risk plan. Calm comparison of scenarios before execution protects against impulsive decisions.
Further Perspective: A Position-Sizing Framework for Any Pair#
Risk is the cash amount lost if a stop is reached, not the number of lots selected because a platform permits them. A practical sequence is: choose the maximum cash loss, determine a technically justified stop distance, calculate pip value, then derive the smallest appropriate volume. If the required volume is unavailable, do not force the trade. For a 200-dollar account and a two-dollar risk limit, a 40-pip stop allows five cents per pip before costs. If the minimum trade size creates a larger loss, the account or instrument does not fit the plan. Read the complete risk-management guide before increasing leverage. Do not treat this as a universal rule detached from your circumstances; connect it to account size, costs, broker terms, and the risk plan. Calm comparison of scenarios before execution protects against impulsive decisions.
Further Perspective: What a Currency Pair Actually Quotes#
EUR/USD at 1.1000 says that one euro is worth 1.10 US dollars. EUR is the base currency and USD is the quote currency. Buying the pair means buying euros and selling dollars together; selling it reverses that exposure. A quotation is therefore a comparison, not a prediction that one country is universally strong or weak. If EUR/USD moves from 1.1000 to 1.1050, the euro has gained five US cents per euro against the dollar. That move can arise from stronger euro-area data, weaker US data, changing rate expectations, or a change in risk appetite. The chart alone does not identify the cause. Do not treat this as a universal rule detached from your circumstances; connect it to account size, costs, broker terms, and the risk plan. Calm comparison of scenarios before execution protects against impulsive decisions.
Further Perspective: Bid, Ask, and the Price You Can Trade#
A platform normally shows a bid and an ask. You sell at the bid and buy at the ask. Their difference is the spread, an immediate cost that changes with liquidity, volatility, the broker's pricing model, and the time of day. A chart may display a mid-price, which is not necessarily the price at which an order can be filled. Suppose EUR/USD is quoted 1.10000 bid and 1.10012 ask. A new buy begins twelve points behind the bid before commission, financing, or slippage. Treat an advertised minimum spread as a marketing snapshot, not as a promise for every trading condition. Do not treat this as a universal rule detached from your circumstances; connect it to account size, costs, broker terms, and the risk plan. Calm comparison of scenarios before execution protects against impulsive decisions.
Further Perspective: Major Pairs and Their Economic Drivers#
Major pairs combine the US dollar with another heavily traded currency. EUR/USD, GBP/USD, USD/JPY, USD/CHF, AUD/USD, USD/CAD, and NZD/USD are commonly described as majors. They often have deeper normal liquidity than other retail symbols, but major does not mean calm, guaranteed, or appropriate for every strategy. EUR/USD can react to the ECB, the Federal Reserve, inflation, growth, and risk sentiment. USD/JPY can respond to US yields, Bank of Japan policy, and changing appetite for risk. USD/CAD can also react to Canadian economic releases and oil-market developments. A trader needs an economic map, not a nickname. Do not treat this as a universal rule detached from your circumstances; connect it to account size, costs, broker terms, and the risk plan. Calm comparison of scenarios before execution protects against impulsive decisions.