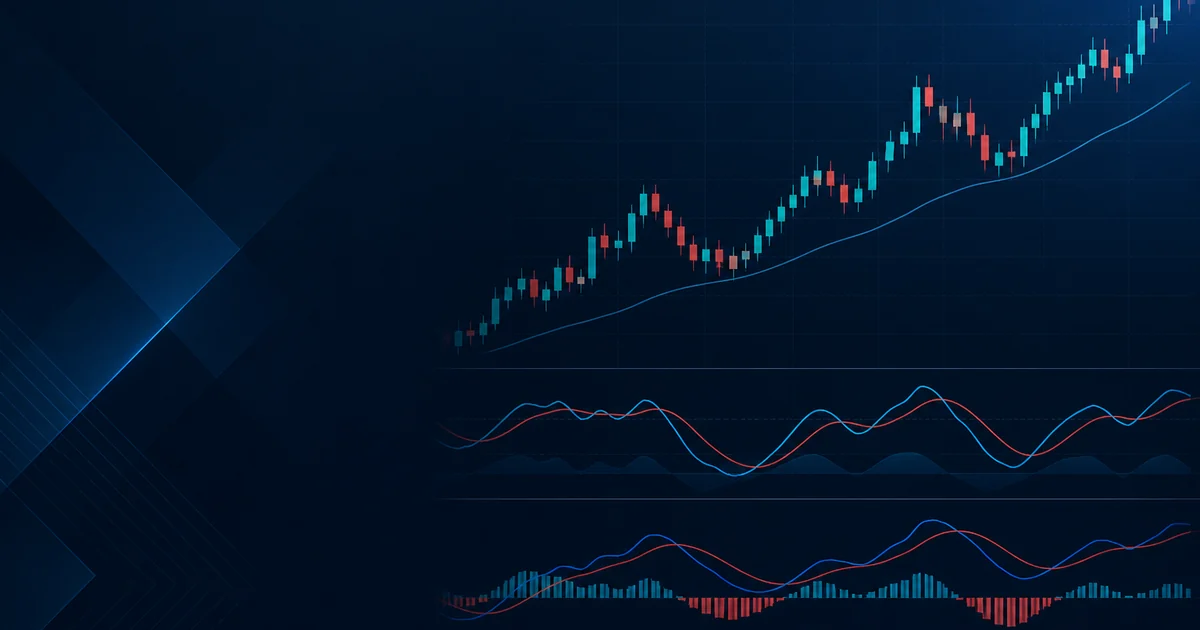
- Indicators simplify price information but do not predict with certainty
- Moving averages show trend context
- RSI and MACD describe momentum
- ATR helps with volatility-aware stops
- Too many indicators create confusion and false confidence

Quick Decision Framework#
Short Answer
Beginners should start small: a moving average for trend context, RSI for stretch, MACD for momentum change, ATR for stop distance, and optionally Bollinger Bands for range width. No indicator is a standalone buy or sell signal. Indicators simplify price; they do not predict it.
Detailed Explanation
A moving average tells you whether you are buying dips in an uptrend or selling rallies in a downtrend. RSI near 70 or 30 is a warning about stretch, not an automatic reverse. MACD highlights a shift in momentum after the fact. ATR stops you from placing a 10-pip stop on a pair that is travelling 30 pips a session. Too many studies create false confidence and conflicting arrows. The plan — pair, session, risk percent, invalidation — comes first; the indicator is a filter.
Example
Price is above a 50-period EMA on H4, RSI is 62 (not extreme), and ATR says a 30-pip stop is reasonable on 0.01 lot for a $2,000 account risking 1%. That is a beginner-legal ticket. The same trader buying solely because RSI printed 28 on a 5-minute chart, with no EMA context, is using the tool as a crystal ball.
Common Mistake
Taking every RSI cross of 30 as a long, especially against a clear daily downtrend. Mean-reversion tools fail when the regime is a trend.
Professional Tip
On demo, trade ten tickets with only EMA + ATR + a written stop. Add RSI only after those ten are journaled. If you cannot explain the stop in pips from ATR, do not add another oscillator.
Quick Answer#
The best forex indicators for beginners are usually:
- Moving averages for trend context.
- RSI for momentum extremes.
- MACD for momentum shifts.
- ATR for volatility and stop distance.
- Bollinger Bands for range and volatility awareness.
No indicator should be treated as a guaranteed Buy or Sell signal. Use indicators with technical analysis, support and resistance, and risk management.
Risk warning: Indicators are decision aids, not profit machines. A chart full of indicators can still produce losing trades.
Moving Averages#
Short Answer
Moving averages help beginners see trend direction and dynamic support or resistance.
Detailed Explanation
A moving average smooths price over a chosen number of candles. A 50-period moving average shows medium-term context; a 200-period moving average shows longer context. When price stays above a rising moving average, the market may be in an uptrend. When it stays below a falling one, the market may be in a downtrend.
Moving averages lag price. They are not magic entries. Their value is context.
Example
A beginner avoids short trades while EUR/USD is above a rising 50-period moving average and only looks for pullback buys after confirmation.
Common Mistake
Buying only because price touches a moving average.
Professional Tip
Use one or two moving averages at most. Five averages usually hide the chart instead of clarifying it.
RSI#
Short Answer
RSI helps identify momentum extremes, but overbought does not always mean sell.
Detailed Explanation
The Relative Strength Index often ranges from 0 to 100. Traders commonly watch zones such as 70 and 30. In a strong trend, RSI can stay high or low for longer than beginners expect. That is why RSI should be combined with trend context, support/resistance, and a clear exit.
Example
In an uptrend, RSI dropping near 40 and turning up may be more useful than selling every time RSI reaches 70.
Common Mistake
Shorting a strong uptrend simply because RSI is overbought.
Professional Tip
Ask: is RSI warning of exhaustion, or is it confirming strong momentum?
MACD#
Short Answer
MACD helps show momentum shifts and trend strength.
Detailed Explanation
MACD compares moving averages and often includes a signal line and histogram. Beginners use it to see whether momentum is strengthening or weakening. It can help filter entries, but it can also lag in fast markets or chop during ranges.
Example
A trader uses MACD histogram turning positive as confirmation after price breaks a resistance level.
Common Mistake
Taking every MACD crossover as a trade signal.
Professional Tip
MACD works better as confirmation than as the only reason to enter.
ATR and Bollinger Bands#
Short Answer
ATR measures volatility; Bollinger Bands show range expansion and contraction.
Detailed Explanation
ATR can help set stop-loss distances that respect normal movement. A tight stop on a volatile pair may be hit before the idea has failed. Bollinger Bands can show whether price is compressed or stretched, but touching a band is not automatically a reversal.
Example
If ATR shows EUR/USD typically moves 20 pips over the chosen period, a 5-pip stop may be too tight for that setup.
Common Mistake
Using the same stop-loss on every pair regardless of volatility.
Professional Tip
Volatility indicators should shape risk, not encourage larger bets.
Beginner Indicator Plan#
Short Answer
Use one trend tool, one momentum tool, and one risk tool at most.
Detailed Explanation
A clean beginner chart might include a 50-period moving average, RSI, and ATR. The moving average gives context, RSI helps read momentum, and ATR helps avoid unrealistic stops. The plan still needs entry criteria, invalidation, lot size, and review.
Example
"Only trade in the direction of the 50 MA, wait for support/resistance confirmation, use RSI as momentum filter, set stop using structure plus ATR." That is a process. "RSI says buy" is not.
Common Mistake
Adding more indicators after every loss.
Professional Tip
If two indicators answer the same question, remove one.
Bottom Line#
Beginners do not need a perfect indicator. They need a simple chart, written rules, and small risk. Indicators help when they clarify trend, momentum, volatility, or context. They hurt when they replace thinking.
Next read support and resistance, ATR stop loss, and best forex strategy for beginners.
Comments
Add a useful note for other traders. We review comments before publishing.