
- Fibonacci retracement measures how far a pullback has travelled through a prior impulsive swing
- The ratios come from a number sequence; they do not contain a hidden market law
- 38.2%, 50% and 61.8% are the levels most traders actually watch — extra lines usually add noise
- A wrong swing makes every ratio wrong; chop and 1-minute swings are the usual failure mode
- Use Fib as confluence with support/resistance or a higher-timeframe bias, not as a standalone signal
- Extensions project a possible next leg; they are not guaranteed targets

Open Exness — clearer spreads and multi-market trust
- Spreads from 0.0 depending on account type
- Clients and trading volume worldwide
- Automated processing is available for eligible withdrawals
- Start from $10 on the account that fits your country
- MT4, MT5 and the Exness app
- Verify the legal entity before funding
Affiliate & risk disclosure: ForexTradeLab may earn a commission from qualifying broker links. See the affiliate disclosure and risk disclaimer.
Risk warning: Fibonacci levels are not guaranteed bounce prices. Spreads, gaps and news can run through every ratio. This is education, not a strategy that produces a stated win rate. Size so a missed level is a planned loss.
Quick Answer#
Short Answer
A Fibonacci retracement marks how far price has pulled back through a prior impulsive swing. You draw it from the start of that swing to its end. On forex majors, the levels most people actually watch are 38.2%, 50% and 61.8%. They are zones of attention, not official support from a central bank.
Detailed Explanation
The ratios come from the Fibonacci number sequence described in ordinary mathematics references such as Britannica’s Fibonacci-number entry. Dividing a term by the next term approaches the golden-ratio cousin used on charts (~0.618). That is arithmetic. It is not a BIS market-structure law and it is not in an FOMC statement.
Investor.gov defines technical analysis as the study of past price and volume to infer possible future movement — and it does not treat any overlay as a guarantee. The CFTC’s retail FX risk materials make the same point in different words: past patterns do not lock in future fills. Use Fib inside technical analysis and price action, not instead of risk management.
The BIS Triennial Survey shows FX as a multi-trillion-dollar OTC market. Enough humans and machines watch the same default MetaTrader Fib object that a level can become a crowding map. Crowding is not certainty.
Example
Illustrative only. EUR/USD rallies from 1.0800 to 1.1000 — a 200-pip impulse. A 50% retracement is 1.0900. A 61.8% retracement is near 1.0876. Those are questions. A long at 1.0876 without a stop beyond the 1.0800 swing is not a Fib trade; it is an unmarked bet.
Common Mistake
Drawing Fib across a messy range, then blaming “Fibonacci” when every line is hit and ignored.
Professional Tip
If you cannot point to the swing before you open the Fib tool, you do not have a swing. You have decoration.
Where the Ratios Come From (and What They Are Not)#
Short Answer
They are percentages of a measured swing, derived from a famous integer sequence. They are not pip magnets issued by the ECB or the Fed.
Detailed Explanation
The sequence 1, 1, 2, 3, 5, 8, 13, 21… adds each term to the previous. Ratios of neighbouring terms settle near 0.618 and 1.618. Charting packages also print 0.382 (1 − 0.618) and a plain 50% midpoint that is not a Fibonacci neighbour — it is a halfway line traders added because humans like midpoints.
MetaTrader 5’s object help documents the default Fib retracement object. Defaults are a vendor choice. You may hide levels. You should.
What the sequence is not:
- A proof that 61.8% “must” hold on EUR/USD.
- A substitute for support and resistance.
- A reason to skip the economic calendar on CPI day.
Example
Two platforms can print 61.8% a pip apart if they snap to different highs. Your “precise” entry is already a zone.
Common Mistake
Quoting “the golden ratio appears in nature, therefore it must reverse GBP/USD.” Nature analogies are not a trade plan.
Professional Tip
Write the swing prices in the journal: start, end, 38.2, 50, 61.8. If you cannot recompute them with a calculator, you do not understand the overlay you just drew.
How to Choose the Swing#
Short Answer
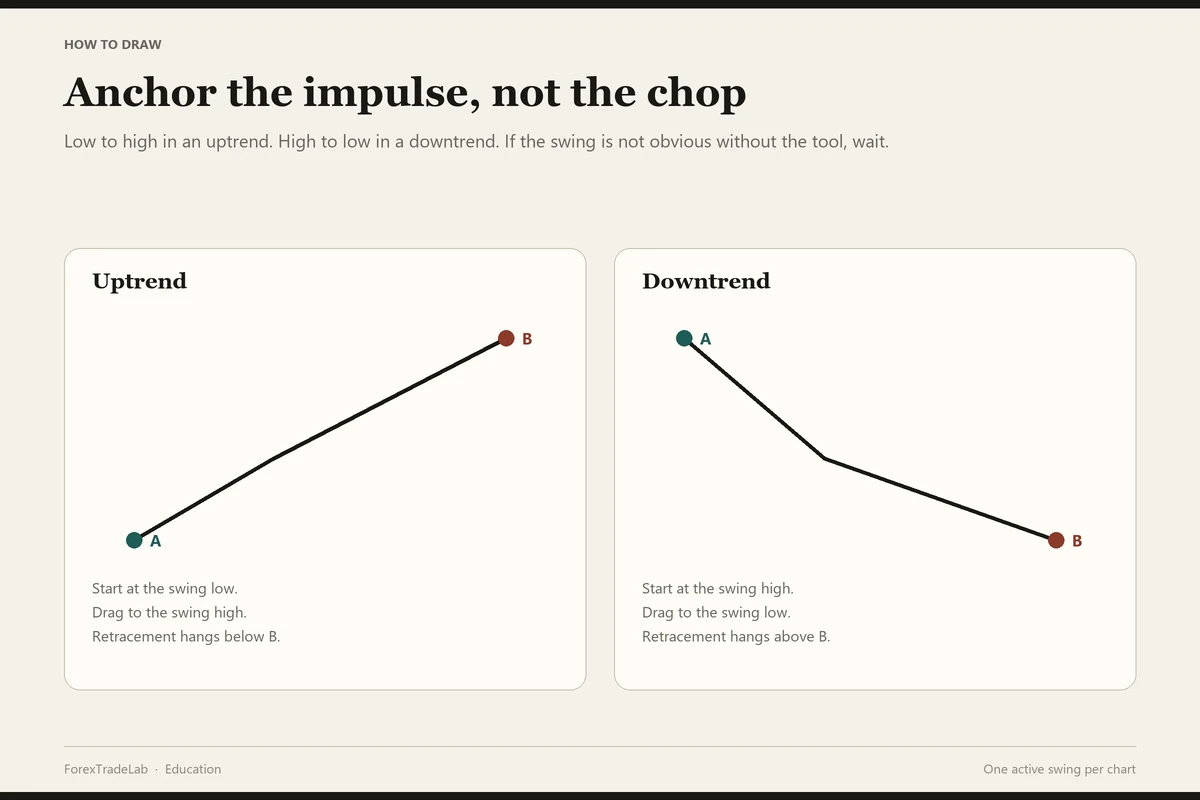
Use a swing that is obvious on the higher timeframe without the tool. Impulse, not chop.
Detailed Explanation
An impulse is a directional leg with a clear start and a clear exhaustion. A chop is a cluster of overlapping candles. Fib on chop draws a ruler across noise.
Start on daily or H4 for bias — see multi-timeframe analysis. Then drop one timeframe for the entry. This is the same discipline as how to read a chart.
Redraw only when a new impulsive extreme is in. Do not redraw mid-trade to make the 61.8% kiss your entry. That is curve-fitting with a mouse.
For gold-specific swings and round-number confluence, use the companion gold Fibonacci strategy — different instrument, same honesty rule.
Example
USD/JPY puts in a two-week rally that anyone can see on D1. You Fib that. You do not Fib this morning’s M15 wiggle inside the London lunch.
Common Mistake
Anchoring to a wick that only exists on one broker’s feed. Check whether the high/low is a shared swing on a second timeframe.
Professional Tip
If three colleagues would pick three different swings, the chart is not ready. Wait for a cleaner leg or stand aside.
The Three Levels That Earn a Place on the Chart#
| Level | What it measures | Typical use |
|---|---|---|
| 38.2% | Shallow pullback | Strong-trend pauses; often fails in ranges |
| 50% | Midpoint of the swing | Widely watched even though it is not a Fib neighbour |
| 61.8% | Deep pullback / golden-ratio cousin | Last common “trend still alive” zone for many desks |
| 78.6% (optional) | Very deep | Written fail line for some plans — not a default buy |
Short Answer
If your platform dumps 23.6, 88.6 and five custom ratios on the candle, hide them. Clutter is how Fib accounts die.
Detailed Explanation
Each extra line is another permission to “buy the dip.” A plan that can buy 38.2, 50, 61.8, 78.6 and “the open” is not a plan. Pair one Fib zone with support/resistance or a supply-demand zone. That is confluence. Seven Fibs is a colouring book.
Indicators can sit beside Fib; they should not multiply it. See RSI, MACD, EMA and ATR for stops.
Example
GBP/USD pulls back to a daily 50% that also sits on a prior H4 supply. You have a zone. You still need a stop and a size from the lot calculator.
Common Mistake
Taking every touch of 38.2% in a range. Shallow Fibs in chop are just mid-range noise.
Professional Tip
One Fib object per chart, tied to the active swing. Archive the old object in a screenshot, do not stack ghosts.
Retracement vs Extension#
Short Answer
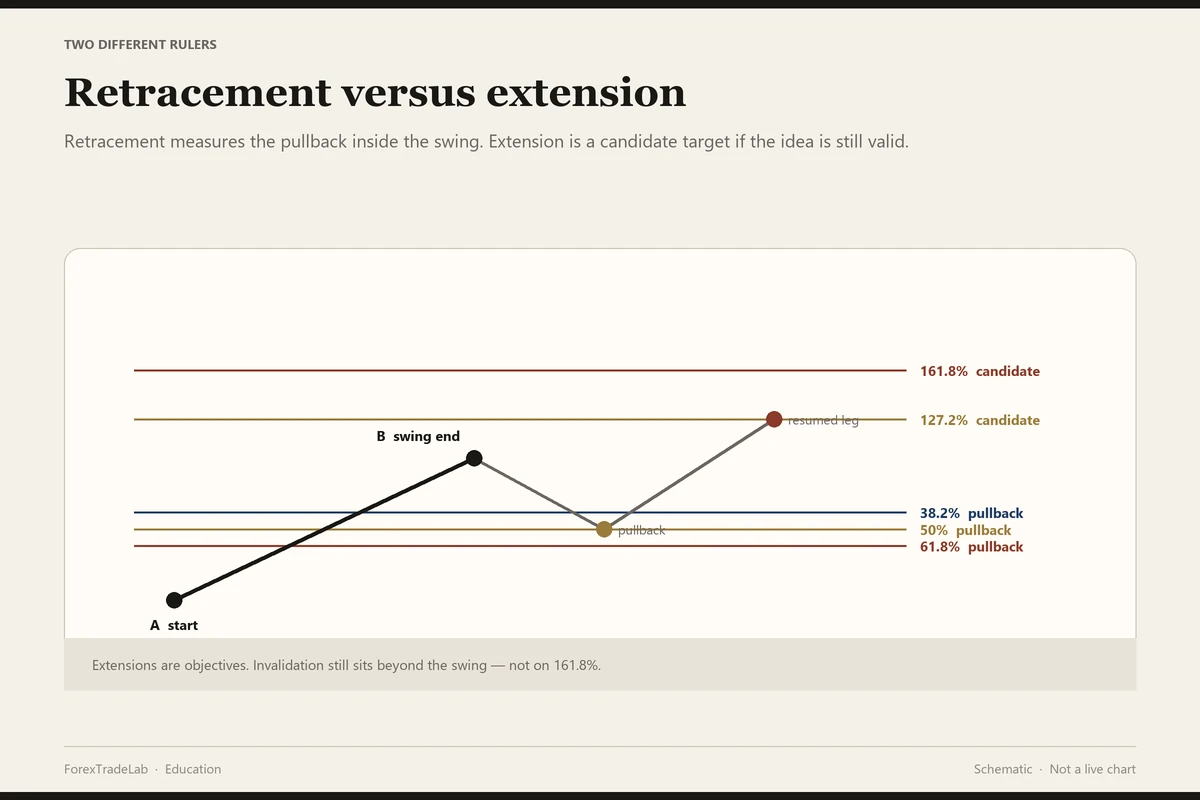
Retracement = how far the pullback has come. Extension = where a resumed leg might travel if the idea is still valid.
Detailed Explanation
After a pullback holds, traders often project 127.2% and 161.8% of the same swing as candidate targets. Candidates are not ATM receipts. A partial take-profit at the first extension and a runner toward the next is a management rule, not a promise.
If the pullback closes beyond your fail line (many plans use a close beyond 78.6% or beyond the swing start), the extension discussion is over. You are in a different market.
Example
Long from a 61.8% zone. First scale at 100% (the old high). Second scale at 127.2% if the structure is still higher highs. Stop stays beyond invalidation — it does not “trail to 38.2 because a video said so” in a range.
Common Mistake
Using an extension as a stop. Extensions are objectives, not invalidation.
Professional Tip
Write target, invalidation and size before the pullback arrives. Fib after the fact is a story you tell yourself.
How Forex Execution Breaks a “Perfect” Level#
Short Answer
A 61.8% line is a price. Your fill is Bid or Ask after spread, slippage and, on news, a gap.
Detailed Explanation
Majors are liquid in the London–New York overlap — see best time to trade — but NFP, CPI and FOMC can jump through every Fib on the book. A stop at “just beyond 61.8” becomes a market order. That is stop slippage, not a broken ratio.
Spread is already in the path. If 61.8% is 1.08760 and the Ask is 1.08785, you did not “buy the Fib.” You bought the Ask.
Example
You place a limit at 50%. News prints. Price gaps through 50% and 61.8% and fills your stop 30 pips worse. The journal line is “gap + market stop,” not “Fibonacci failed.”
Common Mistake
Stacking pending Fib limits into a red-folder minute. Read when not to trade.
Professional Tip
If the event can move more than your stop, you do not have a Fib trade. You have a calendar problem.
A Worked Major-Pair Sketch (Illustrative)#
Short Answer
One swing, three levels, one confirmation, one invalidation. Anything else is optional.
Detailed Explanation
Suppose EUR/USD trends up from 1.0720 to 1.0920 on H4 (200 pips). You hide all but 38.2 / 50 / 61.8. Those print near 1.0844, 1.0820 and 1.0796. Your plan: only consider a long if H4 still makes higher lows and a 4-hour close holds above 1.0790, with a stop under 1.0715 and size from 1% equity. If price slices 1.0715, the swing is wrong — flatten. This sketch is not a live signal and the numbers will be stale the day after you read them.
Pair selection still matters. Exotics can have a Fib “hit” that is smaller than the spread. Start with which pair should I trade.
Example
The 50% zone overlaps yesterday’s broken resistance, now support. That overlap is the reason to look. The reason to click is your written trigger.
Common Mistake
Publishing the Fib after the bounce and calling it a strategy test. That is a screenshot, not a sample.
Professional Tip
Log 20 pre-declared Fib trades on demo: swing, levels, trigger, fill, result. Ten pretty winners chosen after the fact teach nothing. See backtesting.
Key Takeaways#
- Fib measures a pullback through a swing you must be able to name.
- 38.2, 50 and 61.8 are enough for most majors.
- Ratios are maths plus crowding — not a market law.
- Wrong swing, wrong everything.
- Confluence and a stop beat a favourite number.
- Extensions are targets, not guarantees.
Glossary#
- Impulse / swing: The directional leg you measure.
- Retracement: Pullback as a percentage of that leg.
- Extension: Projection beyond the end of the leg.
- Golden-ratio cousin: ~61.8% / 161.8% from neighbouring Fibonacci terms.
- Confluence: Two independent reasons in the same zone.
- Invalidation: The price that kills the idea — usually beyond the swing.
Checklist#
- Bias timeframe chosen (D1 or H4).
- Swing obvious without the tool.
- Anchors: low→high or high→low, not mixed.
- Only 38.2 / 50 / 61.8 visible.
- Confirmation rule written.
- Stop beyond invalidation; lot equals 1–2% risk.
- No red-folder pending stack.
- Journal the swing prices, not only the screenshot.
Future related articles#
- Fibonacci time zones: why most retail calendars should ignore them
- How to combine Fib with VWAP without double-counting the same midpoint
- Broker-feed wick differences: when two Fibs disagree by a pip

Comments
Add a useful note for other traders. We review comments before publishing.