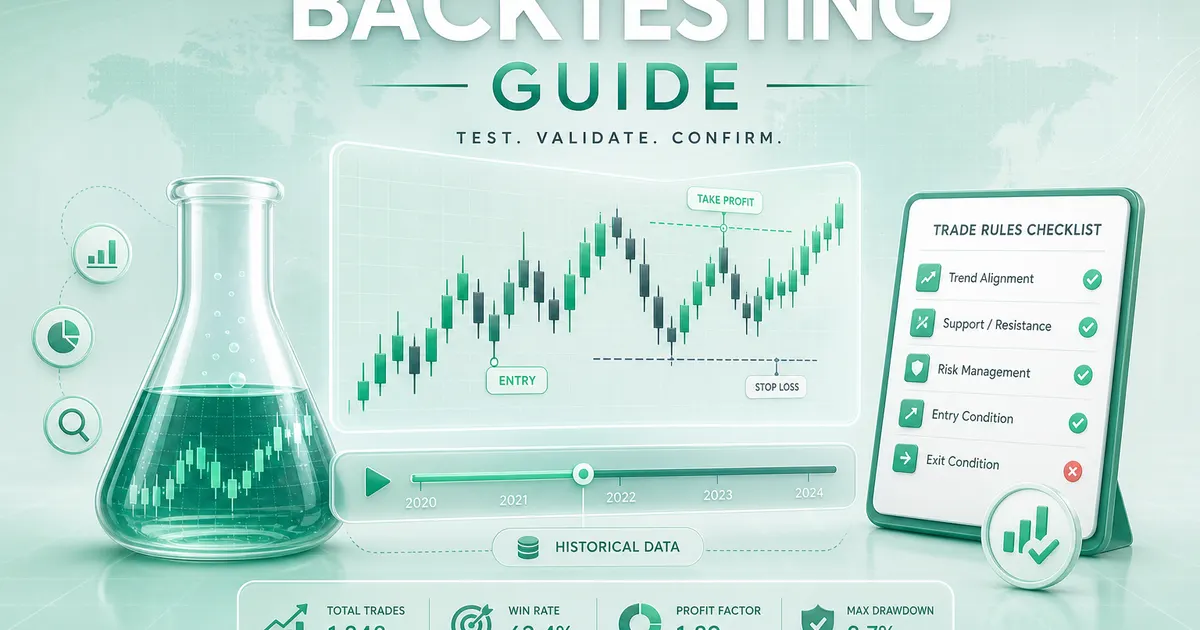
- Backtesting applies a clearly specified trading rule to historical market data to estimate how it would have behaved under stated assumptions. It is a research method, not a proof of future profitability.
- Read the written broker terms before funding an account
- Use defined cash risk and realistic cost assumptions
- Educational content, not personal investment, legal, or religious advice

Backtesting answer framework#
Short Answer
Backtesting applies fixed rules to historical data to estimate past behavior; it can reject weak ideas but cannot prove future profit.
Detailed Explanation
A credible test fixes entries, exits, sizing and costs in advance, avoids future information and reserves unseen data for validation. Sample size and market regimes matter more than a smooth curve.
Example
Test a EUR/USD rule first on development data, add spread and commission, then run it unchanged on a later period. Deterioration out of sample is evidence against deployment.
Common Mistake
Repeatedly tuning the same history until results look attractive creates overfitting.
Professional Tip
Preserve rejected versions and forward-test any surviving rule on demo before risking money.
Introduction#
Forex backtesting applies fixed trading rules to historical data to estimate how they would have behaved under stated assumptions. It is a research method, not proof of future profit. A credible test makes its hypothesis, data, costs, execution model and failures visible enough for another person to challenge.
This guide shows how to move from an idea to a reproducible test, protect an out-of-sample period and decide whether limited forward observation is justified. Pair it with technical analysis for objective signals, risk management for sizing, trading psychology for researcher bias, demo accounts for forward testing and MetaTrader 5 for platform context.
Short Answer#
A backtest is useful when it answers a narrow, falsifiable question with rules fixed before results are inspected. It must use suitable documented data, avoid future information, subtract realistic costs and reserve unseen data for an independent challenge.
Suppose a daily EUR/USD breakout is developed on 2014–2023 data while 2024–2025 is kept untouched. The model includes spread, commission and a volatility-based stop. Strong development results are not enough: if performance disappears in the holdout or with a one-bar exit change, fragility is the finding.
The common mistake is searching combinations until one equity curve looks smooth. Professional advice: preserve rejected versions and count every parameter, pair and timeframe tried, because repeated searching increases the chance of finding luck.
How It Works#
First translate the idea into deterministic rules. “Buy at strong support” is not testable until support, confirmation, entry timing, stop, target, expiry and conflicting signals are defined. Manual tests still need the same discipline; knowing what happened next can quietly alter a subjective decision.
The engine then steps through historical observations and simulates orders using only information available at each decision time. Bar data can hide intrabar sequence, bid/ask prices, missing quotes, rollover and slippage. These omissions matter most to tight-stop or exact-touch systems.
Development data is in sample. A separate out-of-sample segment is withheld until the hypothesis and parameters are fixed. If the researcher repeatedly checks the holdout and retunes the method, that period has become part of development and a new holdout is needed.
Practical Process#
- Write the hypothesis and rulebook before viewing performance. Specify market, timeframe, entry, exit, sizing, simultaneous exposure, costs and missing-data treatment.
- Record the data vendor, time zone, bar construction, bid/ask treatment and date range. A “daily” candle can differ across feeds.
- Divide development and holdout periods before optimisation. Preserve the split and every version tested.
- Run the model and retain the raw trade list so entries, exits and calculations can be audited.
- Calculate net expectancy, hit rate, average win and loss, maximum drawdown, losing streak and exposure—not only cumulative profit.
- Stress costs and fills, test distinct market regimes and perturb nearby parameters. A method that collapses when a moving average changes from 20 to 21 is suspect.
- Lock the rules, inspect the holdout once and document the result whether favourable or not.
- If evidence remains credible, use demo or very small forward observation to test alerts, execution and discipline. Forward testing is another test, not confirmation of guaranteed profit.
Decision Framework#
Use four gates before advancing a strategy:
- Reproducibility: Could another researcher generate the same trades from the written rules and identified data?
- Realism: Do prices, costs, swap, order timing and position constraints resemble the intended account?
- Robustness: Does the result survive unseen periods, worse costs, different regimes and small parameter changes?
- Risk relevance: Is performance acceptable after drawdown, losing streaks and aggregate exposure are considered?
No single threshold proves validity. A large trade count from one narrow regime may contain less information than a smaller sample spanning different conditions. Likewise, cumulative profit can depend on a few outliers while the typical trade loses.
The decision should be “reject,” “revise and retest with a fresh holdout,” or “advance to limited forward observation.” It should never jump from an attractive report directly to meaningful live capital.
Risks and Limits#
Look-ahead bias uses information unavailable at the simulated decision time. Survivorship bias excludes instruments or markets that disappeared. Optimisation bias selects the best result from many trials. Each can create a convincing report without a tradable edge.
Execution modelling is another limit. A bar may show that both target and stop traded without revealing which came first. Mid-price data may understate spread, and historical swap or slippage may be unavailable. Ambiguous cases need a declared conservative rule, not whichever assumption improves performance.
An EA report should be treated as a claim to audit. Verify code, data source, account settings, date range, costs, drawdown method and modelling quality. Even an honest historical model cannot prove future market structure or personal suitability.
Worked Example#
A researcher defines a daily EUR/USD breakout: enter at the next bar after a close above a fixed lookback high, place a volatility-based stop and exit after a stated number of bars or at the stop. Data from 2014–2023 is assigned to development; 2024–2025 is sealed as the holdout.
The development test includes conservative spread and commission and appears profitable. Nearby lookback values remain acceptable, but changing the time exit by one bar causes a large deterioration. The untouched holdout then loses after costs.
The correct conclusion is not to search the holdout for a better exit. That would contaminate it. The researcher records parameter fragility and holdout failure, rejects this version and requires a materially revised economic hypothesis plus fresh unseen data before another validation claim.
Checklist#
- The hypothesis and all trading rules were written before results were viewed.
- Data source, time zone, bar construction and bid/ask basis are documented.
- In-sample and holdout periods were fixed in advance.
- Spread, commission, swap and plausible slippage are included where relevant.
- Raw trades and every parameter version are preserved.
- Net expectancy, drawdown, losing streak and exposure are reviewed.
- Costs, regimes and nearby parameters have been stress-tested.
- Holdout failure is recorded rather than optimised away.
- Forward observation uses locked rules and limited risk.
Glossary#
Backtest: A simulation of fixed trading rules on historical data.
In sample: Data used to develop or tune the hypothesis.
Out of sample: Data withheld to challenge rules fixed during development.
Look-ahead bias: Use of information unavailable at the simulated decision time.
Curve fitting: Tailoring rules so closely to history that performance becomes fragile.
Parameter sensitivity: The degree to which small setting changes alter results.
Maximum drawdown: The largest peak-to-later-trough decline in the tested sequence.
Forward test: Observation of locked rules on later data not used in development.
FAQ#
The FAQ above explains data choice, look-ahead bias, curve fitting, sample splits, costs, drawdown, manual and EA tests, and forward testing. Its core rule is to treat every result as conditional evidence, never as a guarantee.
Summary#
Honest backtesting begins with fixed, reproducible rules and documented data. It models net rather than gross results, protects unseen data and searches for fragility through cost, regime and parameter stress. Failure is useful evidence when it is preserved instead of optimised away.
Use technical analysis to make signals objective, risk management to model exposure and demo accounts for the next forward-testing stage. Research discipline matters more than an attractive equity curve.