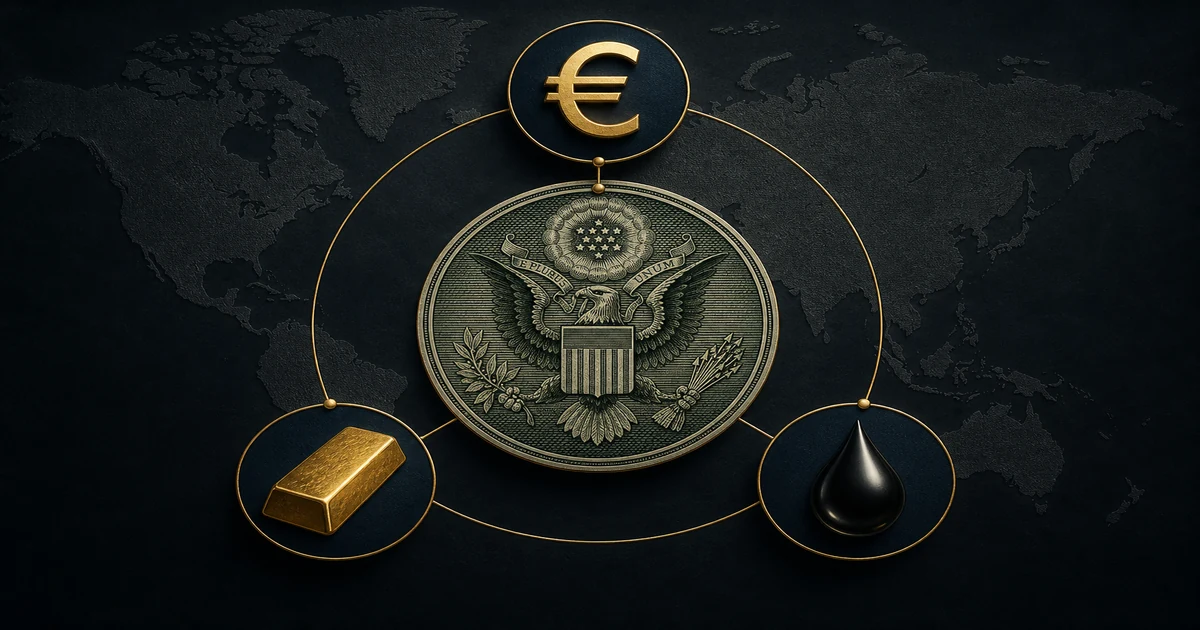
- The BIS 2025 survey put the US dollar on 89.2% of OTC FX trades and the euro on 28.9%
- Gold and crude are quoted in dollars, so one USD or US-rates shock can show up on three charts at once
- In September 2026 the Hormuz oil shock and a Fed hike to 3.75%–4.00% supported the dollar near DXY 101.2 while gold fell about 7% to near $4,125
- Trading EUR/USD, XAU/USD and oil together can be one dollar view, not three independent ideas
- Start with BIS, Fed H.10 and ECB reference rates, then pick one instrument and a cash risk cap

Quick Answer#
Short Answer
The US dollar dominates because it is the market's vehicle currency. The BIS Triennial Central Bank Survey found that in April 2025 the dollar stood on one side of 89.2% of OTC foreign-exchange trades; the euro was the largest counterpart at 28.9%. Gold and crude are priced in dollars, so a Fed, yield or risk-sentiment shock can print on EUR/USD, XAU/USD and oil at the same time.
Detailed Explanation
Dominance is structure, not a buy-dollar signal. It tells you which quotes share a common denominator and therefore which positions can fail together. September 2026 was a live demonstration: an oil shock and a Fed hike supported the dollar, pushed US yields higher and knocked gold about 7% lower within one month.
Example
A trader long EUR/USD and long XAU/USD in early September 2026 held two short-dollar positions. The 16 September Fed hike and a 10-year yield near 5.2% worked against both.
Common Mistake
Reading "the dollar is king" as "always buy USD." Dominance explains correlation, not direction.
Professional Tip
Before any trade on EUR, gold or oil, write one line on the current dollar driver. See our disclaimer and the gold XAU/USD complete guide.
Risk warning: Forex, gold and oil CFDs use leverage. A single USD news event can move all three. This article is educational, not a forecast or personal recommendation. Broker risk warnings often state that a large share of retail CFD accounts lose money.
Affiliate disclosure: ForexTradeLab may earn a commission if you open an account through some broker links on this site. This does not change our analysis or the risks described here. Read our affiliate disclosure.
Dollar, Gold and Oil Snapshot — 29 September 2026#
| Market | Verified reading | Why it matters here |
|---|---|---|
| Gold (XAU/USD) | About $4,125/oz; $4,111 intraday low on 28 Sep (lowest since 5 Aug); early September ≈ $4,510; record ≈ $5,589 (28 Jan 2026) | Dollar-priced haven hit by rising real yields |
| Dollar index (DXY) | ≈ 101.2 | Supported by US rates and the oil shock |
| Fed funds | 3.75%–4.00% after a 25 bp hike on 16 Sep (12–0 vote, first hike since 2023) | US rates are the main dollar driver |
| US 10-year / 10-year TIPS | ≈ 5.2% (highest since 2007) / ≈ 2.8% real (25 Sep) | Higher opportunity cost of holding gold |
| Brent crude | ≈ $106–107 (28 Sep); US–Iran conflict and Strait of Hormuz standoff | Supply shock feeding inflation |
| US inflation | August CPI +3.4% y/y, core +2.4% | Keeps further hikes priced (~70% for October, CME FedWatch 28 Sep) |
| Next USD catalysts | Jobs 2 Oct · CPI 14 Oct (8:30 a.m. ET) · FOMC 27–28 Oct and 8–9 Dec | Scheduled days when all three charts can move together |
Figures are approximate and change daily; EUR/USD is not quoted here — check the latest H.10 or ECB reference rate. Verify live before trading. Sources: Reuters/WAM, Federal Reserve, BLS.
What "Dollar Dominance" Means in Practice#
Short Answer
It means most global FX tickets, and the main commodity benchmarks, use USD as one leg — not that the dollar only goes up.
Detailed Explanation
The BIS 2025 release is the clean primary source:
- Average daily OTC FX turnover: $9.6 trillion
- Dollar share of trades (one side): 89.2% (88.4% in 2022)
- Euro share: 28.9% (30.6% in 2022)
- The most-traded pairs in the survey all involve the dollar
IMF exchange-rate basics explain why a widely used currency lowers transaction costs in trade and finance. The IMF's COFER dataset separately tracks the dollar's role in allocated official reserves. Turnover share and reserve share are related stories, not identical numbers — do not paste a reserve percentage onto a retail EUR/USD ticket.
For intending traders, the practical result is simple: on a typical platform the liquid names — EUR/USD, XAU/USD, WTI, Brent — all speak USD.
Example
You never click a "USD" button. You buy EUR/USD (short dollar versus euro), buy gold (often pressured when the dollar and real yields jump), or sell oil (sometimes easier when the dollar is bid). Three screens. One language.
Common Mistake
Reading "the dollar is king" as "always buy USD pairs." Kings also fall on FOMC days.
Professional Tip
Keep a single USD diary: Fed funds expectations, 2-year and 10-year US yields, and DXY or the Fed's broad dollar index. Then open one chart. See the US dollar and DXY guide.
The Euro Is the Main Counterpart, Not a Parallel System#
Short Answer
The euro is the largest non-dollar currency in FX turnover. EUR/USD is the standard way retail traders express euro versus dollar.
Detailed Explanation
A 28.9% euro share does not mean "almost one-third of the world abandoned the dollar." Currency shares in the BIS survey sum to 200% because every trade has two sides, so the dollar can be on 89.2% of trades while the euro is on 28.9%.
That arithmetic is why EUR/USD is the research and beginner default in what is forex and EUR/USD vs GBP/USD vs XAU/USD. Official public quotes live on the ECB reference-rate page and the Fed H.10 release. Use the latest print as a public benchmark, not as your broker fill.
ECB policy, euro-area inflation and US–EU growth gaps can move EUR/USD even when the "dollar story" is quiet. The pair is a relative price.
Example
US data is mixed and Europe prints a hotter inflation number. EUR/USD can rise while DXY is little changed because the impulse is euro-led. A dollar-only narrative would have missed it.
Common Mistake
Treating every EUR/USD candle as "the Fed did that."
Professional Tip
Split your journal into "US impulse / Europe impulse / risk-off impulse." How interest rates and central banks affect forex is the companion piece.
Why Gold Speaks Dollar#
Short Answer
The liquid benchmark is dollars per troy ounce. A stronger dollar and higher real yields usually make gold harder to hold — as September 2026 showed.
Detailed Explanation
The LBMA Gold Price auctions (10:30 and 15:00 London, administered by ICE Benchmark Administration) and COMEX futures both price in USD. Retail platforms label the contract XAU/USD: you are trading a dollar gold price, not buying a bar, as explained in buy/sell dollars, euros, gold and oil through a broker and the gold trading guide.
Drivers that often arrive through the dollar channel:
- Real US yields (opportunity cost of holding non-yielding gold) — about 2.8% on 10-year TIPS in late September 2026
- Fed hike or cut expectations — ~70% odds of an October hike as of 28 September
- Broad dollar strength or weakness
- Risk events that lift both the dollar and gold — the correlation is unstable
Non-dollar demand still matters: central banks bought a record 288.9 t in Q2 2026 and gold ETF holdings reached a record 4,189 t in August (World Gold Council). Those flows cushioned gold but did not stop September's fall once yields surged.
Example
One standard gold lot is 100 oz, so at about $4,125 it is roughly $412,500 notional and each $1 move is $100. A trader long 0.10 lot ($10 per $1) from $4,510 to $4,125 is down about $3,850 — the September 2026 move expressed in cash. If the same trader was also long EUR/USD, the hike hit both positions.
Common Mistake
Using the same 0.10 lot on gold and EUR/USD because "both are majors on my watchlist." At current prices 0.10 gold carries far more dollar risk per typical daily range.
Professional Tip
Compare dollar-value risk at the stop, not lot labels. Gold position-sizing: gold lot size guide; drivers: gold, the Fed and the dollar 2026.
Why Oil Speaks Dollar#
Short Answer
WTI and Brent are dollar prices. Oil also has a supply story that can overpower the dollar for weeks — as the 2026 Hormuz standoff did.
Detailed Explanation
International crude is conventionally invoiced in USD. When the dollar strengthens, a barrel can become more expensive in local currency for importers, which may weigh on demand — a tendency, not a law. OPEC+ decisions, inventory reports, outages and conflicts can dominate. That is why the oil trading guide and oil inventory watchlist exist as separate clusters.
For Gulf readers, the UAE dirham (3.6725 per USD) and Saudi riyal (3.75 per USD) are pegged, which adds a second dollar exposure: income, imports and an oil or gold CFD can all lean the same way. Local 24K gold at about $132.6 per gram is roughly AED 487 or SAR 497 per gram — approximate conversions, not souk quotes.
ESMA's EU retail CFD caps are 30:1 for major FX, 20:1 for gold and 10:1 for commodities other than gold. Where those rules apply, oil is structurally more margin-heavy per unit of notional — another reason not to copy-paste forex lots.
Example
In September 2026 Brent held near $106–107 on the Hormuz standoff while the dollar was supported by a Fed hike. A "strong dollar equals weak oil" slogan would have been the wrong read: supply dominated.
Common Mistake
Stacking long oil, long gold and short EUR/USD as "three hedges" during a geopolitical shock without measuring how each reacts to US rates.
Professional Tip
If your oil thesis is supply, you do not need a second dollar trade on the same account unless the spec and risk cap say you do. Read forex correlation and concentration and the oil, gold and dollar guide.
Case Study: September 2026 — One Chain, Three Charts#
Short Answer
An oil shock raised inflation risk, the Fed hiked, US yields rose, the dollar was supported and gold fell — one macro chain visible on oil, DXY and XAU/USD at once.
Detailed Explanation
- Oil: the US–Iran conflict (since late February 2026) and the Strait of Hormuz standoff kept Brent near $106–107.
- Inflation: August CPI rose 3.4% y/y; the Fed's September projections show 3.7% PCE inflation for 2026.
- Policy: on 16 September the Fed raised rates 25 bp to 3.75%–4.00% (12–0), its first hike since 2023; the median projection is 4.1% for end-2026.
- Yields and dollar: the 10-year Treasury reached about 5.2% and 10-year TIPS about 2.8%; DXY stood near 101.2.
- Gold: from about $4,510 early in the month to a $4,111 low on 28 September and about $4,125 on 29 September — roughly −7% for September.
Bank forecasts were trimmed but stayed above spot: Goldman Sachs (18 Sep) cut its end-2026 target to $4,650; UBS (17 Sep) sees $4,600 for December 2026; JPMorgan sees $4,500 for Q4 2026. Forecasts are opinions, not guarantees.
Example
Three open trades — long EUR/USD, long gold, short oil — look diversified. In this chain, the first two lost on the dollar and rates leg, and the third lost on the supply leg. Nothing hedged anything.
Common Mistake
Assuming a geopolitical crisis automatically means "gold up, dollar down." In 2026 the crisis worked through oil and inflation, which strengthened the case for higher US rates.
Professional Tip
When oil and US yields rise together, check your whole book for short-dollar exposure before the next US data release (2 October jobs, 14 October CPI). Related: safe-haven currencies 2026 and risk-on vs risk-off explained.
The Hidden Triple Bet#
Short Answer
EUR/USD, XAU/USD and oil can be three expressions of one USD view.
Detailed Explanation
| If your true view is… | Cleaner first expression | Easy way to double-count |
|---|---|---|
| US yields up, dollar bid | Sell EUR/USD (if Europe is not the story) | Also short gold and short oil "for confirmation" |
| Dollar cheap, risk-on | Buy EUR/USD or a risk currency | Add long gold and long oil at full size |
| Geopolitical oil shock | Oil spec with small size | Assume gold and USD will obediently follow (September 2026: gold fell, the dollar was supported) |
Researchers can stop at the table. Intending traders must convert it into one live market until they can journal overlapping risk.
Example
Account $10,000. Three positions, all dollar-short in spirit: 0.20 EUR/USD, 0.05 gold ($5 per $1 on about $20,600 notional) and a small oil position. A strong US jobs report can hit all three. That is not diversification. It is leverage on a theme.
Common Mistake
Calling the stack "a portfolio" because the symbols have different names.
Professional Tip
Cap theme risk: the combined cash loss if the dollar jumps across open trades should still respect your daily loss limit. Tools: risk management guide.
How Researchers Should Use This#
Short Answer
Cite BIS, Fed and ECB. Do not cite a broker banner as proof of how the global market is built.
Detailed Explanation
A solid one-page research note needs:
- BIS turnover and currency shares (dated April 2025)
- A public USD/EUR print from H.10 or ECB, with its date
- A sentence that gold and oil are dollar-quoted benchmarks (LBMA, COMEX, Brent, WTI)
- A sentence that retail CFDs are not ownership
The CFTC forex fraud advisory is the right citation when a pitch claims exclusive access to "the dollar market."
Example
A student compares dollar dominance in 2022 versus 2025 using BIS shares (88.4% to 89.2%). That is a sourced paragraph. A viral claim that "everyone will dump the dollar next month" is not.
Common Mistake
Using a live oil CFD screenshot as evidence of official US energy policy.
Professional Tip
Archive the BIS release date in your notes. Surveys are triennial; mixing 2019 and 2025 figures without labels creates false trends.
How Intending Traders Should Use This#
Short Answer
Pick one USD expression, demo it through a scheduled US event, then decide.
Detailed Explanation
Practical order:
- Confirm legality and a verifiable broker entity — choose a broker
- Learn buy vs sell without confusing it with cash delivery — long vs short
- Start with EUR/USD unless your written plan says otherwise
- Add gold or oil only after the market-fit logic passes on your spec
- Keep risk at a small fraction of equity; leverage caps are not position-size advice
How to start forex trading remains the process document. This article only explains why the dollar keeps appearing.
Example
FOMC week (27–28 October 2026). You plan one EUR/USD demo trade with a pre-written stop. You do not also open gold and oil "because everything is USD." After 20 rule-following trades, reassess.
Common Mistake
Raising gold leverage because "the dollar thesis is obvious." Obvious theses still gap — gold fell about 4% intraday on 28 September.
Professional Tip
If you cannot explain in one sentence whether your edge is Europe, US rates or oil supply, you are not ready to combine symbols.
Comparison: What Each Market Is Actually Pricing#
| Instrument | What the quote mainly is | Dollar channel | Extra channel you must respect |
|---|---|---|---|
| EUR/USD | Dollars per euro (relative) | Direct | ECB, euro-area data |
| XAU/USD | Gold in USD per troy ounce | Strong | Real yields, central-bank and ETF demand, risk events |
| WTI / Brent CFD | Crude in USD per barrel | Medium | Inventories, OPEC+, geopolitics (Hormuz 2026), contract specs |
No row is "easier money." Rows differ in what can prove you wrong.
Checklist#
- BIS 2025 figures recorded with the survey month (April 2025)
- Dollar thesis written in one sentence
- Snapshot checked live: DXY, US 10-year yield, gold, Brent
- Only one live or demo symbol until overlap is measured
- Fed H.10 or ECB print used as a public reference, not as a fill
- Gold and oil treated as dollar-priced, not as dollar-proof hedges
- Position size from stop and contract value (gold: 1 lot = 100 oz)
- Broker entity verified; CFTC/FCA-style scam patterns rejected
- Daily loss cap includes combined USD-theme risk
- Calendar marked: 2 Oct jobs, 14 Oct CPI, 27–28 Oct FOMC
- No essential-living money in the account
Mini Glossary#
| Term | Meaning |
|---|---|
| Vehicle currency | USD's role as one side of most FX trades |
| Turnover share | BIS percentage of trades involving a currency (sums to 200%) |
| COFER | IMF data on the currency mix of official FX reserves |
| DXY | US dollar index versus a six-currency basket, euro-heavy |
| Real yield | Nominal yield minus expected inflation; about 2.8% on 10-year TIPS in late Sep 2026 |
| Invoice currency | The currency in which oil or goods are billed — often USD |
| Currency peg | Fixed exchange rate, e.g. AED 3.6725 or SAR 3.75 per USD |
| Theme risk | Several symbols that lose together when USD moves |
Key Takeaways#
- The dollar dominates because of market structure (BIS 89.2% FX share), not because social media crowned it.
- The euro is the main counterpart; EUR/USD is a relative price, not a dollar monologue.
- Gold and oil quotes in USD can transmit the same shock — or ignore it when supply or yields dominate.
- September 2026: oil shock plus Fed hike supported the dollar while gold fell about 7% to near $4,125.
- Stacking EUR, gold and oil can be one bet with three tickets. Researchers cite BIS, Fed and ECB; intending traders add demo, one symbol and a cash cap.
Related Reading and Future Cluster Pages#
- Gold XAU/USD trading complete guide (pillar)
- Gold, the Fed and the dollar: 2026 analysis
- Gold–dollar correlation trading
- Can you buy dollars, euros, gold and oil through a forex broker?
- US dollar and DXY
- How Fed decisions affect markets
- Safe-haven USD, JPY, CHF and gold
- Risk-on vs risk-off markets explained
- Fundamental analysis guide
Suggested future articles: the dollar smile for retail traders; Fed versus ECB week playbook; whether a gold CFD hedges a USD income in a pegged Gulf currency; oil supply shocks and the Fed reaction function.
Bottom Line#
If you came here as a researcher, you now have citable BIS and central-bank structure: the dollar sits under forex, gold and oil quotes. If you came here intending to trade, treat that structure as a correlation warning, not as a reason to click three buys. September 2026 showed how one chain — oil, inflation, the Fed, yields — can move all three screens. Choose one expression of the dollar, practise it, and keep risk small. The next practical step is either the product-type explainer or the start-trading checklist.
Comments
Add a useful note for other traders. We review comments before publishing.