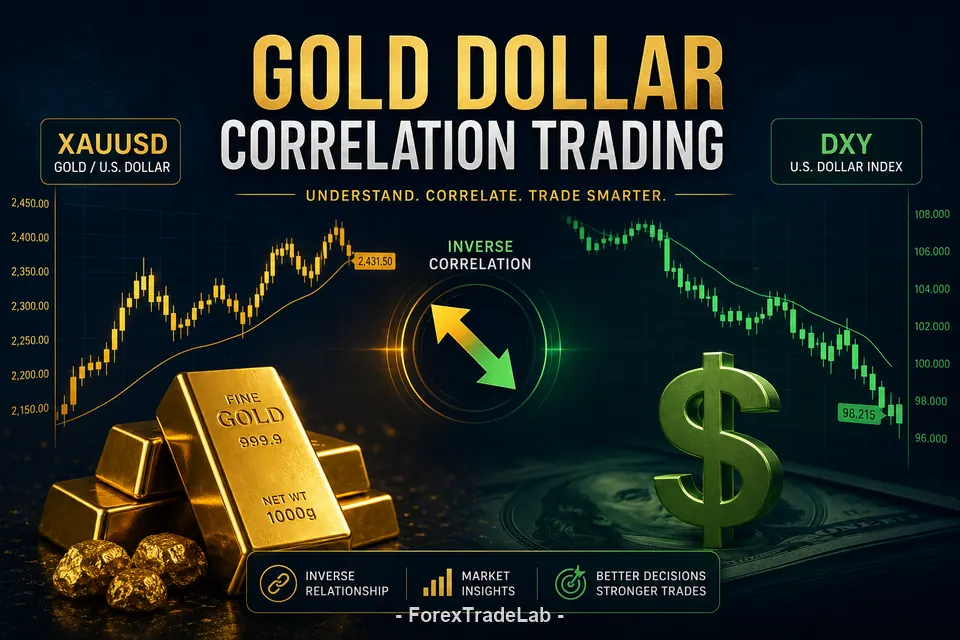
- Gold and the US dollar usually move in opposite directions because of dollar pricing, opportunity cost and global demand effects
- The strength of the relationship varies by timeframe and period, so no single correlation coefficient is reliable
- The link can break when both act as safe havens, when central-bank buying dominates, or when DXY moves on euro-specific news
- Real yields, such as the 10-year TIPS yield near 2.8% in September 2026, are often the cleanest macro filter for gold
- Use DXY and real yields to confirm or reject gold setups on the same timeframe you trade, and size positions by dollar risk

Affiliate disclosure: ForexTradeLab may earn a commission from qualifying partner links, without increasing your cost. Read our affiliate disclosure.
Risk warning: Correlations are statistical tendencies, not guarantees. Gold CFDs and spot XAU/USD are leveraged products and most retail accounts lose money trading them. Levels on this page are dated and illustrative. This guide is educational and is not investment advice or a trade signal.
If you trade gold without watching the US dollar and real yields, you are missing the most useful filters available. The inverse relationship between XAU/USD and the US Dollar Index (DXY) is one of the most watched in markets — but it is a tendency whose strength changes over time, not a fixed ratio. This guide explains why the link exists, when it breaks, and how to use it in practice. For the full gold framework, start with the complete XAU/USD trading guide.
Gold and dollar snapshot — 29 September 2026#
| Metric | Approximate level | Source |
|---|---|---|
| Spot gold (XAU/USD) | about $4,125/oz; 28 Sep low $4,111 | Reuters |
| US Dollar Index (DXY) | about 101.2 | Market data, 29 Sep 2026 |
| 10-year TIPS real yield | about 2.8% (25 Sep) | Market data |
| US 10-year Treasury yield | about 5.2% (28 Sep), highest since 2007 | Market data |
| Fed funds target range | 3.75%–4.00% after a 25 bp hike on 16 Sep 2026 | Federal Reserve |
| Next US catalysts | Jobs 2 Oct; CPI 14 Oct; FOMC 27–28 Oct 2026 | BLS, Federal Reserve |
| Central-bank buying | 345 t in H1 2026 | WGC |
Verify live before trading. These are dated reference levels, not signals.
Why Do Gold and the Dollar Move Inversely?#
Short Answer
Gold is priced in dollars and pays no yield. A stronger dollar makes gold more expensive for non-dollar buyers, and the forces that lift the dollar — Fed hikes and rising real yields — also raise the cost of holding gold. So XAU/USD usually falls when the dollar and real yields rise.
Detailed Explanation
Three mechanisms reinforce each other:
- Pricing: gold is quoted in dollars worldwide. If the dollar strengthens, each ounce costs more in euros, yen, rupees or yuan, which can dampen demand and push the dollar price down.
- Opportunity cost: Treasuries and dollar cash pay interest; gold does not. When the Fed hikes, as it did on 16 September 2026 (to 3.75%–4.00%), dollar assets become more attractive relative to gold.
- Global demand: a weaker dollar makes gold cheaper for large non-US buyers — jewellery markets in Asia and the Gulf, and central banks — and a stronger dollar has the opposite effect.
The size of gold's reaction to a given dollar move is not fixed. It depends on what is driving the dollar, what is already priced and whether other gold drivers are active at the same time.
Example
On 28 September 2026, Treasury yields surged and markets priced more Fed hikes; spot gold fell about 4% intraday to $4,111. The rate channel (higher yields and hike odds) and the dollar channel (DXY near 101.2) pointed the same way, so the bearish move in gold was confirmed by its macro filters. On 0.10 lot (10 oz), a $170 intraday drop equals about $1,700.
Common Mistake
Assuming a fixed ratio, such as "a 1% DXY move equals a 1–1.5% gold move". No stable ratio exists; it changes with the regime.
Professional Tip
Always identify why the dollar is moving. A dollar rally driven by rising US real yields usually hits gold harder than one driven by euro weakness. For all gold drivers, see what moves gold prices.
Measuring the Relationship: DXY vs XAU/USD#
Short Answer
DXY measures the dollar against six currencies, dominated by the euro (57.6%). You can measure the gold-DXY relationship with a rolling correlation of daily or hourly returns, but its value depends heavily on the window and period you choose.
Detailed Explanation
| Currency | DXY weight |
|---|---|
| Euro (EUR) | 57.6% |
| Japanese yen (JPY) | 13.6% |
| British pound (GBP) | 11.9% |
| Canadian dollar (CAD) | 9.1% |
| Swedish krona (SEK) | 4.2% |
| Swiss franc (CHF) | 3.6% |
Because the euro dominates the basket, DXY moves largely with EUR/USD. DXY does not include the yuan, rupee or Gulf currencies, so it is an imperfect measure of the dollar against gold's biggest physical buyers.
How to measure it yourself: export daily closes for XAU/USD and DXY, convert both to percentage changes, and calculate a rolling correlation (for example 30, 60 and 120 days) in a spreadsheet using the CORREL function. You will see the value drift over time — sometimes strongly negative, sometimes near zero, occasionally positive. That variation is the point: we do not publish a single coefficient because it would mislead.
Example
Run a 30-day and a 120-day rolling correlation on the same data. If the 30-day figure is much less negative than the 120-day figure, the short-term relationship is weakening relative to its longer history — a signal to rely less on DXY as a filter for now.
Common Mistake
Reading correlation as causation or as a percentage explained. A correlation measures how consistently two series move together, not how much of gold's move the dollar "causes".
Professional Tip
Measure correlation on the same timeframe you trade. A daily correlation tells a scalper little about the next 15 minutes. For dollar mechanics, see our US dollar and DXY guide.
When Does the Gold-Dollar Correlation Break Down?#
Short Answer
The inverse link weakens or reverses when both act as safe havens, when central-bank buying dominates gold demand, or when DXY moves for euro-specific reasons. In these phases gold and the dollar can rise or fall together.
Detailed Explanation
Scenario 1 — Simultaneous safe-haven demand. In extreme stress, investors buy both Treasuries (lifting the dollar) and gold. In March 2020 both spiked during the initial COVID panic before normal behaviour resumed.
Scenario 2 — Central-bank buying overrides the dollar. Official buyers diversify reserves on multi-year horizons. Central banks bought 863.3 t in 2025 and 345 t in H1 2026, including a record 288.9 t in Q2 (WGC). This kind of demand can support gold even when the dollar is firm.
Scenario 3 — Euro-specific weakness. With the euro at 57.6% of DXY, European stress can lift DXY without genuine broad-based dollar strength; gold may barely react.
Scenario 4 — Oil-driven inflation shocks. In 2026 the US–Iran conflict pushed Brent near $106–107, raising inflation fears and Fed-hike expectations. Here the rate channel dominated: yields rose and gold fell, even though geopolitical risk would normally support it.
Example
In the first half of 2026, record Q2 central-bank buying coincided with a Q2 average LBMA price of $4,506.3, down from a record Q1 average of $4,872.9. Structural buying cushioned the decline but did not reverse it — evidence that official demand can soften, not cancel, rate and dollar pressure.
Common Mistake
Assuming that when gold and DXY move together, "one of them must be wrong". Both can be right if different drivers are acting on each.
Professional Tip
When the relationship weakens, find the cause before trading: a crisis, central-bank flows, euro news or an oil shock. Then reduce size until the dollar filter becomes reliable again. The safe-haven currencies guide covers crisis behaviour.
Practical Framework: Using DXY and Real Yields to Filter Gold Trades#
Short Answer
Before each gold trade, check the direction of DXY and the 10-year real yield on your trading timeframe. Trade full planned size only when both confirm; reduce size when they are mixed; skip or minimise when both oppose your gold idea.
Detailed Explanation
| Gold setup | DXY and real yields | Action |
|---|---|---|
| Bullish gold | Both falling | Confirmed — planned size |
| Bullish gold | Mixed or flat | Partial confirmation — reduced size |
| Bullish gold | Both rising | Conflicting — skip or minimal size |
| Bearish gold | Both rising | Confirmed — planned size |
| Bearish gold | Mixed or flat | Partial confirmation — reduced size |
| Bearish gold | Both falling | Conflicting — skip or minimal size |
Multi-chart setup:
- XAU/USD — your trading chart.
- DXY (or an inverted DXY overlay on gold).
- US 10-year TIPS yield (FRED series DFII10) or, intraday, the 10-year Treasury yield as a proxy.
Example
Illustrative levels, not a live signal. Late September 2026: gold is near $4,125 after a seven-week low; the 10-year yield is near 5.2% and real yields near 2.8% after the Fed hike. A trader sees a bullish reversal candle at an illustrative $4,100 support. Because real yields and hike odds are still rising, the table says "conflicting": the trader either skips or takes 0.02 lot instead of 0.05 lot. With a $30 stop ($4,070), risk falls from $150 to $60.
Common Mistake
Using the filter only when it agrees with the trade you already wanted.
Professional Tip
Log DXY and real-yield direction for every gold trade in your journal. After 50 trades, compare results for "confirmed" vs "conflicting" setups — your own data will tell you how much weight the filter deserves.
Intraday Use: When the Link Is Strongest#
Short Answer
The dollar-gold link is usually tightest around US data releases and FOMC decisions, when one piece of news reprices both. It is usually weakest in the Asian session and in holiday-thinned markets.
Detailed Explanation
- US data at 8:30 a.m. ET: jobs (next 2 October 2026) and CPI (next 14 October 2026) move rate expectations, the dollar and gold at the same moment.
- FOMC at 2:00 p.m. ET: hawkish surprises lift yields and the dollar and usually weigh on gold; dovish surprises do the opposite. Next meetings: 27–28 October and 8–9 December 2026.
- Asian session and holidays: thinner liquidity makes both series noisier and the link less dependable.
Example
If CPI on 14 October prints above expectations, a typical reaction would be higher yields, a firmer DXY and lower gold within minutes. A trader planning a long gold position would wait for that first reaction to settle before checking whether DXY and yields have reversed.
Common Mistake
Holding a leveraged gold position through a release without a plan because "the correlation will protect me". It will not; both markets can gap.
Professional Tip
Watch the dollar and yields in the first minutes after a release. They often react to the headline number first, and gold's sustained move tends to follow their direction. See trading gold around CPI, NFP and FOMC.
EUR/USD as a Gold Proxy#
Because the euro is 57.6% of DXY, EUR/USD can serve as a simplified dollar filter: a rising EUR/USD (weaker dollar) tends to support gold, and a falling EUR/USD tends to weigh on it. The limitation is that EUR/USD reflects only one part of dollar strength; if the dollar is rising against the yen and commodity currencies but falling against the euro, EUR/USD may give a misleading signal.
A Simple Rules-Based Gold-Dollar System#
Entry conditions (long gold)#
- DXY below its 20-period EMA on the 4-hour chart.
- XAU/USD above its 20-period EMA on the 4-hour chart.
- A 1-hour pullback to support (EMA, Fibonacci or round number).
- A bullish reversal candle at that support.
Entry conditions (short gold)#
- DXY above its 20-period EMA on the 4-hour chart.
- XAU/USD below its 20-period EMA on the 4-hour chart.
- A 1-hour rally into resistance.
- A bearish reversal candle at that resistance.
Risk management#
- Stop: 1.5× ATR(14) beyond entry.
- Target: 2.5× risk or the next major level.
- Size: risk no more than 1% of the account. Lot size = risk in dollars ÷ (stop distance in dollars × 100).
Worked sizing example: account $5,000, 1% risk = $50. ATR(14) on the 4-hour chart is, for illustration, $20, so the stop is $30. Lot size = $50 ÷ ($30 × 100) ≈ 0.016, rounded down to 0.01 lot (risk $30). See gold lot size calculation. For chart setups, read the gold technical analysis guide; for faster approaches, the gold scalping strategy.
Common Mistakes#
- Ignoring the dollar around news. US data can move DXY, yields and gold together in seconds.
- Treating correlation as fixed. Its strength varies by timeframe and period.
- Mismatched timeframes. Check DXY on the same timeframe you trade gold.
- Forgetting real yields. A dollar move driven by euro weakness may barely affect gold; one driven by US real yields usually does.
- Quoting coefficients without a window. Any correlation number without its window and period is meaningless.
Key Takeaways#
- Gold and the dollar usually move inversely, driven by pricing, opportunity cost and global demand.
- The strength of the link varies — measure it yourself on your own timeframe rather than trusting a single number.
- It breaks down in liquidity panics, during heavy central-bank buying, on euro-specific news and in oil-driven inflation shocks.
- Real yields are often the cleanest filter; in September 2026 the 10-year TIPS yield was near 2.8%.
- Use DXY and real yields to confirm or reject setups, and size by dollar risk.
Gold-Dollar Trading Checklist#
- DXY direction noted on your trading timeframe
- 10-year real yield (or 10-year Treasury yield intraday) direction noted
- Reason for the dollar move identified (US rates, euro news, risk-off)
- Rolling correlation compared with its own recent history
- Economic calendar checked (jobs 2 Oct, CPI 14 Oct, FOMC 27–28 Oct 2026)
- Current XAU/USD spread within your normal range
- Position sized to 1% risk or less using dollar stop distance
- Plan written for what you will do if gold and DXY move together
Glossary#
- Correlation: Statistical measure (−1 to +1) of how consistently two series move together.
- Rolling correlation: Correlation recalculated over a moving window, such as 30 or 60 days.
- DXY: US Dollar Index against six currencies, with the euro at 57.6%.
- Real yield: Bond yield after inflation, usually the 10-year TIPS yield.
- Opportunity cost: Return given up by holding one asset instead of another.
- Safe haven: Asset investors buy in stress, such as Treasuries, the dollar or gold.
- ATR: Average True Range, used to size stops.
Related Gold Guides#
- Complete XAU/USD trading guide — the gold pillar page
- Gold, the Fed, the dollar and central banks in 2026 — current macro backdrop
- Gold or dollar in 2026? — savings perspective
- Gold price per gram — convert spot into retail units
- What moves gold prices — nine drivers explained
Practise this framework on a demo account where you can watch gold, DXY and yields side by side.
Comments 5
The inverse correlation between DXY and gold isn't as reliable as it was pre-2024. There have been several periods this year where both gold and the dollar strengthened simultaneously during geopolitical escalations. The article should note that the correlation weakens during risk-off events.
Short and focused — didn't waste my time with unnecessary padding. Got the information I needed and can move forward now. The part on Gold vs Dollar Correlation made it easier to apply.
Useful perspective. I'd add that keeping a trading journal alongside this approach makes a significant difference in long-term improvement. The part on Gold vs Dollar Correlation made it easier to apply.
I tried using DXY as a filter on small XAU/USD trades, but the correlation broke during risk-off sessions. The article's warning about treating it as context, not a signal, is important.
Using DXY as a leading indicator for XAU/USD entries has improved my timing significantly. When DXY breaks a key level I give gold about 15-30 minutes to react before entering. The lag exists because institutional order flow takes time to reprice across markets.
Add a useful note for other traders. We review comments before publishing.