
- Each dot is one person’s appropriate-policy midpoint, rounded to 1/8 point — not a scheduled hike
- The median is a headline; the range and central tendency show disagreement
- SEP participants include non-voters; the rate decision is a separate 12-member vote
- Diff this SEP against the last one before you invent a story
- Dots are not CME FedWatch; one is a survey of officials, the other is a futures map
- Do not trade the first USD spike unless spread, slippage and a cash loss limit already fit the plan

Affiliate & risk disclosure: ForexTradeLab may earn a commission from qualifying broker links. See the affiliate disclosure and risk disclaimer.
Risk warning: FOMC days can gap through stops and widen spreads for minutes. This page is SEP literacy, not a call to trade the September 2026 package or the next meeting. Never size a position you cannot survive if the fill is several times worse than the last quote.
Quick Answer#
Short Answer
The FOMC dot plot is one figure inside the quarterly Summary of Economic Projections (SEP). Each circle is one participant’s view of the appropriate federal-funds-rate midpoint at a year-end or in the longer run. The median is a caption. It is not a scheduled hike and not a reason, by itself, to buy or sell the dollar.
Detailed Explanation
The Fed’s own guide to the SEP is blunt about the job: Board members and Reserve Bank presidents submit projections four times a year — March, June, September and December. The funds-rate dots were added in January 2012. “Appropriate monetary policy” means the path each person thinks is most likely to serve their reading of the dual mandate, not a bargain the Committee just voted.
That is why a 12–0 rate decision can sit next to an 18-person cloud of dots. The statement is a vote. The plot is a survey. Forex desks care about both, then about the gap versus what was already priced. Pair this page with hawkish versus dovish language — the adjectives and the dots are two instruments, not one signal.
Example
Illustrative only. Futures already imply a year-end midpoint near 4.1 percent. The SEP median prints 4.1 percent. The dots can be “hawkish” in a recap thread and still be no surprise in the two-year yield.
Common Mistake
Hearing “the Fed sees two more hikes” from a median that was already in the curve, then buying USD into a wide Sunday-to-Monday spread.
Professional Tip
Write one sentence before 14:00 Eastern: “Priced year-end midpoint is X; I will only act if the SEP package is clearly easier or tighter than X.” If you cannot write that sentence, you are watching a graphic, not reading a projection.
What One Dot Actually Is#
Short Answer
One circle is one official’s year-end (or longer-run) midpoint for the appropriate target range or target level, rounded to the nearest 1/8 percentage point. It is not a calendar of meetings.
Detailed Explanation
The accessible note under Figure 2 of the 16 September 2026 SEP says exactly that. Eighteen participants submitted information that meeting; one of those 18 did not submit 2028 and 2029. The dots are anonymous. You cannot map a 4.375 circle to a named hawk.
The SEP timeline matters for citation: the figure is unofficially called the “dot plot,” but the official object is the SEP funds-rate figure. Treat social-media redraws as secondary. Open the .gov HTML or PDF.
A longer-run dot is not “2029.” It is a convergence estimate: where that person thinks the funds rate would settle under appropriate policy and no further shocks. The September 2026 longer-run median is 3.2 percent (June: 3.1). That is a slow-moving belief about neutral, not a tradeable 2026 level.
Example
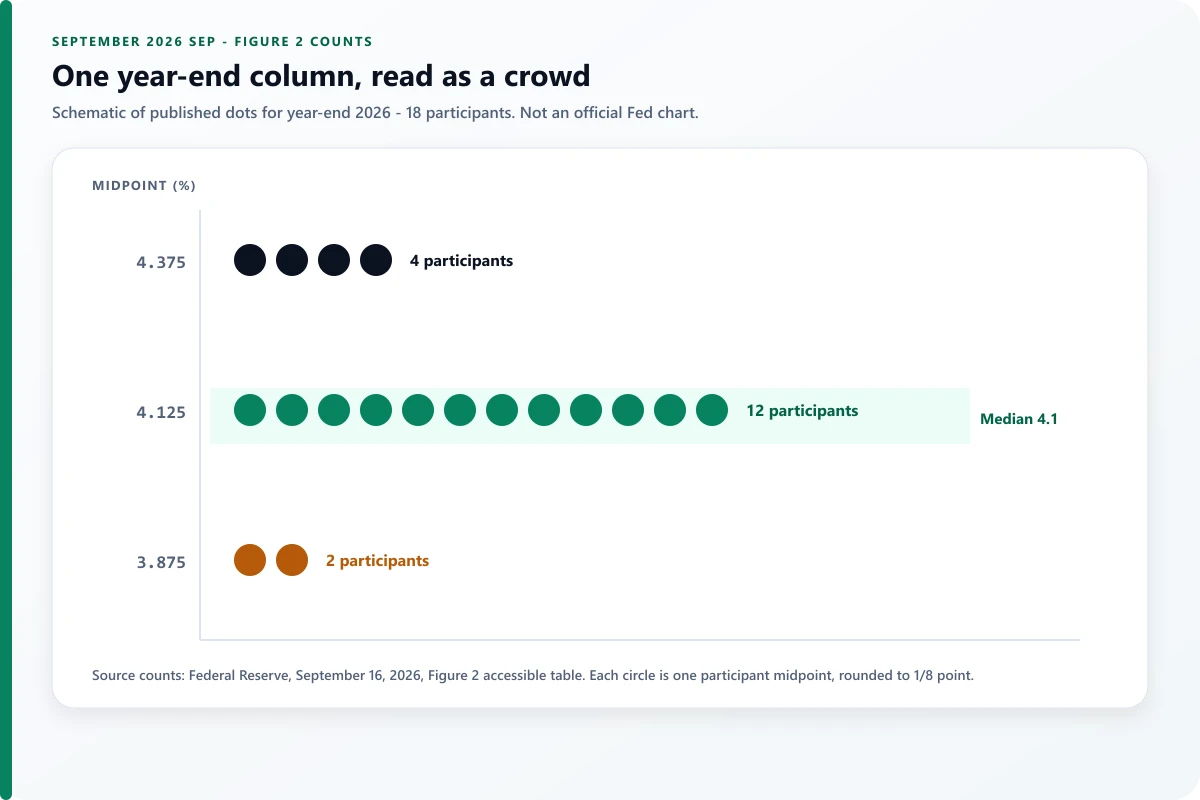
A participant who wants a 4.00–4.25 percent target at year-end appears as a circle at 4.125. Twelve of the 18 September 2026 year-end dots sit there. That cluster is the story. The published median of 4.1 is the middle of a sorted list, not a different rate.
Common Mistake
Counting “how many hikes from here” by subtracting today’s target from the median and dividing by 25 basis points, then treating the remainder as booked.
Professional Tip
Read the decision first. On 16 September 2026 the Committee raised the target range by 25 basis points to 3.75–4.00 percent. The new midpoint is 3.875. The median year-end sketch at 4.1 sits above that print. Whether FX cares depends on whether 4.1 was already the market’s year-end.
How to Read One Year-End Column#
Short Answer
Look at where the pile is, then at the tails. A median can sit inside a tight pile or between two camps. Those are different committees.
Detailed Explanation
For year-end 2026 the official Figure 2 counts are:
| Midpoint (%) | Participants |
|---|---|
| 4.375 | 4 |
| 4.125 | 12 |
| 3.875 | 2 |
Eighteen people. Twelve of them occupy one eighth-point. Two sit on the new target midpoint of 3.875 — they sketch no further hike after the September move. Four sketch a higher year-end. The pile is not a 50/50 civil war. It is a majority around 4.125 with a hawkish tail.
That is the professional read: mode and tails, then median. Recap television often inverts the order.

Example
If 9 dots sat at 3.625 and 9 at 4.625, the median could still print near 4.1. The economic story would be a split Committee, not a calm 4.1 path. September 2026 is the opposite laboratory: a crowded 4.125 shelf.
Common Mistake
Treating two lonely 3.875 dots as “the doves control the year.” They are the range, not the pile.
Professional Tip
Screenshot the official figure and write the three counts in your journal. Next quarter you will need those counts more than the pretty redraw.
Median, Central Tendency, Range#
Short Answer
The Fed publishes three compressed views of the same cloud. Quote all three or you are quoting a headline writer.
Detailed Explanation
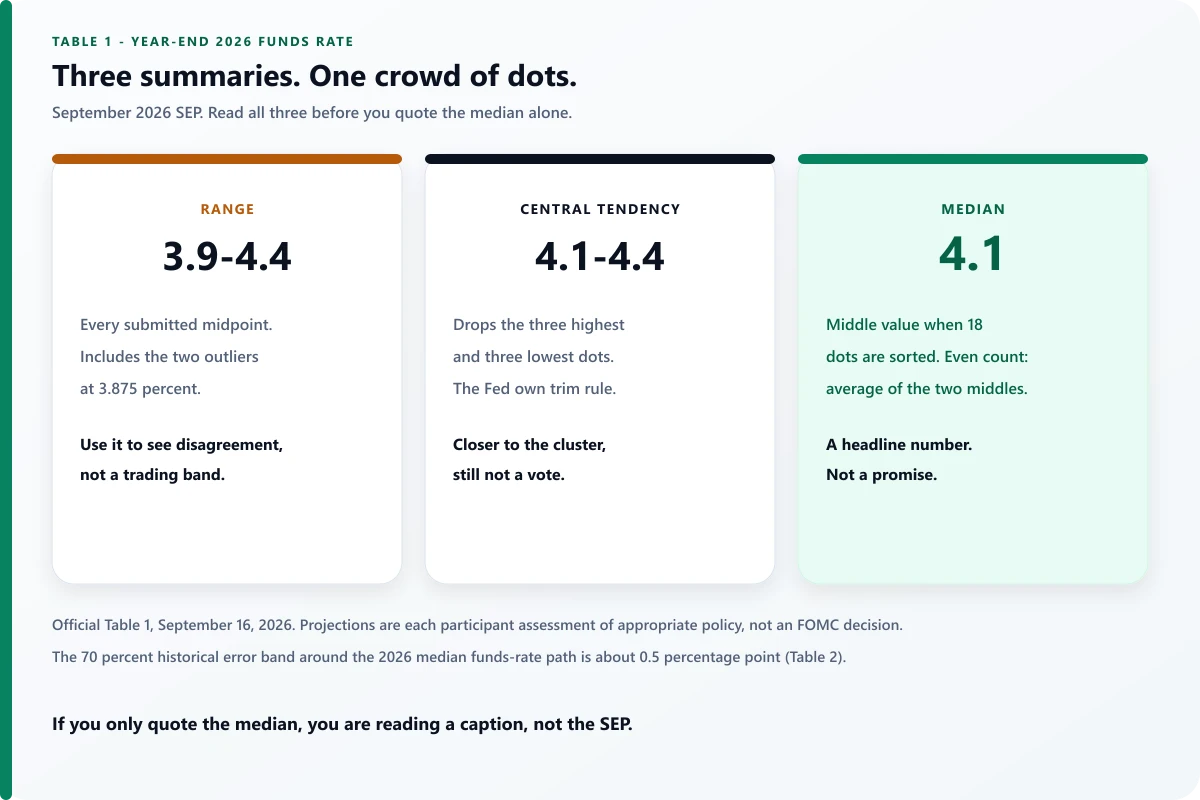
From Table 1, September 2026, year-end federal funds rate:
| Summary | Value | Official rule |
|---|---|---|
| Median | 4.1 | Middle projection; if the count is even, average of the two middles |
| Central tendency | 4.1–4.4 | Drops the three highest and three lowest |
| Range | 3.9–4.4 | Every submitted midpoint |
Table 2 then reminds you that even a tidy median sits inside a wide historical error band. For 2026 the published short-rate error range is about ±0.5 percentage point on a 70 percent historical-error reading. The fan chart around the median funds-rate path for 2026 runs roughly 3.6 to 4.6 percent. That band is forecast-error history, not a permission to fade 4.1 on a five-minute chart.
The same table’s inflation row is why many September dots sit high: median PCE inflation for 2026 is 3.7 percent (June: 3.6), still far from the 2 percent longer-run inflation projection. Median unemployment for 2026 is 4.1 percent (June: 4.3). Growth is 2.3 percent (June: 2.2). The funds-rate dots did not float free of that sketch.
Example
A commentator says “the Fed’s range is 3.9 to 4.4, so anything in between is consensus.” No. Consensus, if the word means anything here, is closer to the central tendency and the 4.125 pile. The 3.9 edge is two people.
Common Mistake
Using the Table 2 fan as a take-profit. Historical RMSE is not your pair’s average true range.
Professional Tip
If you keep one SEP number besides the median, keep PCE inflation for this year. A 4.1 funds-rate median next to 3.7 percent PCE is a different story from a 4.1 median next to 2.1 percent PCE.
Eighteen Dots, Twelve Votes#
Short Answer
The people who submit projections are not identical to the people who vote that afternoon. Non-voters still get a circle.
Detailed Explanation
Reserve Bank presidents rotate voting seats. All of them still file an SEP in March, June, September and December. The 16 September 2026 statement was approved 12–0. The SEP lists 18 submissions. A hawkish non-voter can lift a tail without lifting the vote.
That is why you never say “the Committee dotted 4.1.” The Committee voted 3.75–4.00 percent. Participants sketched year-end 4.1 as the median appropriate path.
Example
A recap that says “unanimous and hawkish” is doing two jobs. Unanimous describes the vote. Hawkish, if it is fair, describes the statement language plus the SEP revision. Keep the labels on the right objects. See how Fed decisions affect markets.
Common Mistake
Assuming a 12–0 hike means the dots must be stacked on one number. The vote can be tight in language and wide in year-end sketches — or the reverse.
Professional Tip
In the journal, three lines: vote; median this year; number of dots on the modal eighth-point. That beats a single adjective.
Diff This SEP Against the Last One#
Short Answer
The tradable SEP fact, when there is one, is usually the change versus June (or versus March), not the level printed in isolation.
Detailed Explanation
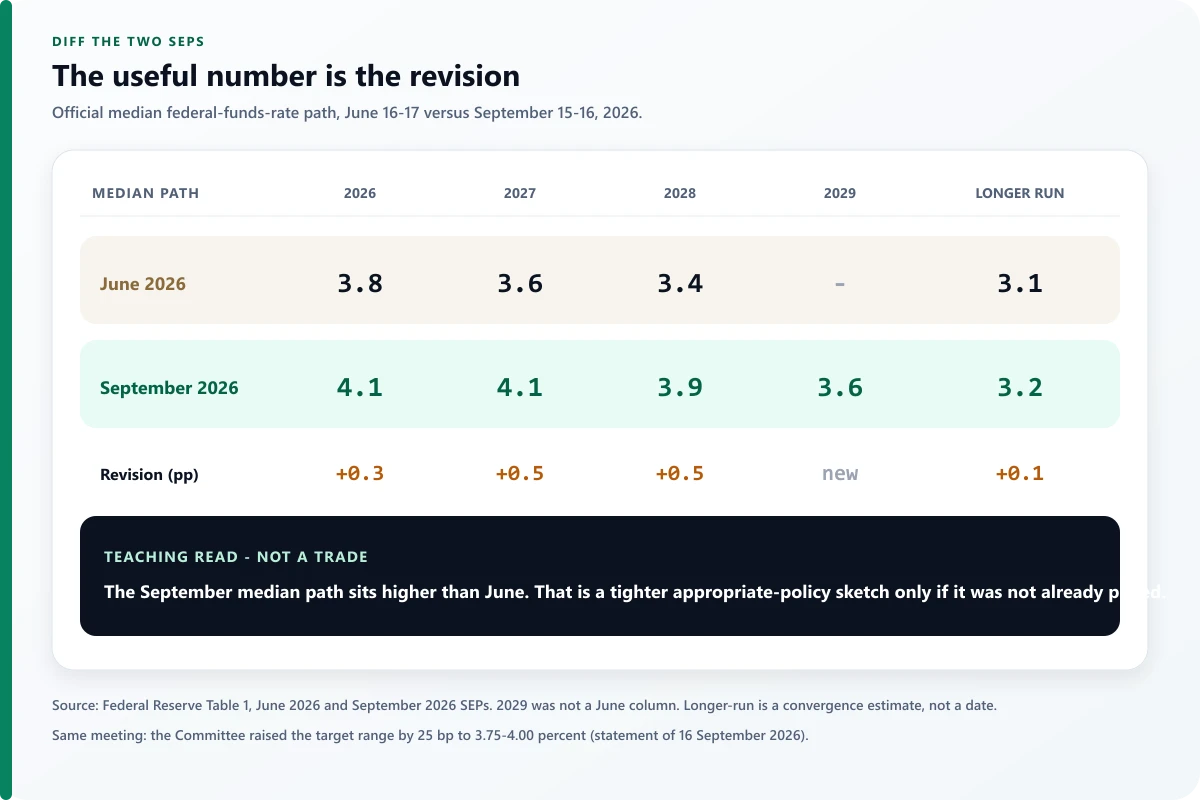
Official median federal-funds-rate paths:
| Horizon | June 2026 | September 2026 | Change |
|---|---|---|---|
| 2026 | 3.8 | 4.1 | +0.3 pp |
| 2027 | 3.6 | 4.1 | +0.5 pp |
| 2028 | 3.4 | 3.9 | +0.5 pp |
| 2029 | — | 3.6 | new column |
| Longer run | 3.1 | 3.2 | +0.1 pp |
September also delivered a 25 basis-point hike to 3.75–4.00 percent. The dots and the action both tightened relative to the June package, which had kept 3.50–3.75 percent and a lower median path. That is a clean teaching case for reading stance versus surprise. It is not a standing order to be long USD into December.
Inflation risk assessments in the same SEP stay one-sided: 17 of 18 participants judged PCE-inflation uncertainty higher than the 20-year norm, and 17 weighted PCE risks to the upside. That is official Table 4.C, not a pundit mood.
Example
If your pre-meeting note already said “they hike 25 and lift the 2026 median toward 4.1,” a print that does exactly that can leave EUR/USD unchanged after the first spike dies. You “called the dots” and still had no edge.
Common Mistake
Comparing September 2026 with a 2024 screenshot you remember from YouTube. The comparable object is June 2026 Table 1.
Professional Tip
Save both PDFs with the dates in the filenames. The FOMC calendar is the index. Your folder is the working set.
Dots Are Not FedWatch#
Short Answer
SEP dots are a survey of officials’ appropriate-policy sketches. CME FedWatch (and similar tools) translate futures into implied probabilities. They can disagree for months without either series being “wrong.”
Detailed Explanation
FedWatch is not a Fed forecast. The Fed says so by simply not publishing it. Futures embed risk premia, positioning and the chance of shocks the SEP’s “no further shocks” longer-run clause explicitly sets aside. Table 2’s error bands exist because the world does not obey the modal sketch.
When the two diverge, desks ask which object just moved. A futures-implied path that was already at 4.1 makes a 4.1 median a confirmation. A futures-implied path at 3.6 makes the same median a hawkish surprise. The USD news playbook is the same surprise-versus-consensus rule applied to CPI and NFP.
BIS April 2025 turnover still puts the dollar on most OTC FX trades. That size does not make your retail fill equal to the official text. Your broker quote is not the SEP.
Example
Illustrative. FedWatch shows a 70 percent chance of no further 2026 hike after the September move. The SEP median still sits at 4.1. Two-year yields can rise on the missing ease in the official sketch even if the decision itself was widely expected.
Common Mistake
Building an EA that buys USD when “median > FedWatch.” The spread, the press conference and the next CPI print will not respect the backtest.
Professional Tip
Log three numbers at send: priced year-end midpoint, SEP median, and the 10-minute change in US two-year yields. If you only log the adjective, you cannot audit the trade.
What Forex Actually Does With the Plot#
Short Answer
Liquid USD pairs often twitch first on US front-end yields and rate differentials. EUR/USD is a Fed-versus-ECB relative price. A higher US median versus a still-easy ECB sketch is not the same trade as a higher US median versus a hawkish ECB week.
Detailed Explanation
How interest rates move FX is the yield channel. The US dollar and DXY guide is the reminder that DXY is a basket, not a moral score for “the Fed won.” Gold often trades the real-rate channel; copying a USD headline onto XAU without yields is a different product. See the gold trading pillar.
Execution is a separate risk. At 14:00 Eastern, spreads jump and a stop becomes a market order. That is slippage, not a broken platform. Read why a stop can fill worse than you set and mark the slot on the economic calendar. Beginners should usually stay flat — the when not to trade checklist exists for this hour.
The second-wave exists because the chair’s first answers can overwrite both the statement and the median. On 16 September 2026 the chair’s published transcript restated that the median participant judged 4.1 percent appropriate by year-end. If a later meeting’s chair walks a median back in minute four, the first candle is not your fill thesis.
Example
Fed SEP tighter, ECB decision six days later. EUR/USD can fall on the US print and reverse if Frankfurt sounds tighter still. The first move was a relative surprise.
Common Mistake
Holding a news scalp through the press conference because “the dots were hawkish.”
Professional Tip
If you must be in the event, pre-define a maximum acceptable fill in money, not in pips. Convert it with the lot and position-size workflow before the calendar turns red. If the first tradable quote is beyond that cash number, the plan is already broken — flatten and write it down.
A Worked Read — September 2026#
Short Answer
Hike 25 basis points to 3.75–4.00, lift the 2026–2028 median path, keep inflation risks to the upside. That package is a tighter official sketch than June. It is a teaching file, not a standing USD long.
Detailed Explanation
Use only the official statement and SEP. Do not invent a live forecast for December. The public record is:
- Action: +25 bp to 3.75–4.00, vote 12–0.
- This-year median funds rate: 4.1 (June 3.8).
- Cluster: 12 of 18 year-end dots at 4.125.
- Inflation sketch: median PCE 3.7 for 2026; 17 of 18 see upside inflation risk.
- Longer run: 3.2, barely changed.
Your job on the next live SEP is to repeat the method: priced path, three summaries, cluster, diff, stay-flat test. Paths change. The FOMC calendars page is the schedule.
Example
Before: “Market already prices a 25 bp hike and a 4.1 year-end.” After: that is what printed. You do not automatically sell EUR/USD. You ask whether EUR pricing already assumed a more-hawkish Fed. If yes, the two-year spread may have done the work last week.
Common Mistake
Screenshotting a TV “dot plot” that drops the 2027–2029 columns. The 2027 median also rose 50 basis points. That is often the part that moves the two-year more than this year’s already-near-spot median.
Professional Tip
Keep a one-page journal: priced path, vote, five SEP lines, two-year yield change, spread at send, fill, and whether you stayed flat. That page teaches more than a month of recap videos. Align the clock with broker server time versus Eastern.
Key Takeaways#
- A dot is one official’s appropriate-policy midpoint, not a meeting-by-meeting calendar.
- The median is a headline; the pile and the tails are the Committee you actually have.
- Voters and SEP submitters are not the same list.
- Diff versus the previous SEP before you write an adjective.
- Dots ≠ FedWatch. Surprise versus the priced path is the FX object.
- If the cash loss limit does not fit the 14:00 Eastern window, the professional trade is no trade.
Glossary#
- SEP: Summary of Economic Projections — quarterly growth, unemployment, inflation and appropriate-policy rate sketches.
- Dot: One participant’s midpoint for the appropriate funds-rate target at a year-end or in the longer run.
- Median: Middle projection in a sorted list; average of the two middles when the count is even.
- Central tendency: Range after dropping the three highest and three lowest projections.
- Longer run: Convergence value with no further shocks, not a calendar date.
- Appropriate policy: Each person’s preferred path for the dual mandate — not the voted decision.
- FedWatch-style path: Market-implied probabilities from futures, not an official forecast.
Checklist#
- Official SEP URL open; social screenshots closed.
- Priced year-end midpoint written before the release.
- Vote recorded separately from the dots.
- Median, central tendency and range for this year copied.
- Modal eighth-point counted.
- Table 1 diff versus last quarter completed.
- PCE and unemployment medians glanced at once.
- Stay-flat test: spread, press-conference risk, cash limit.
- Journal: statement time, SEP time, first path-changing answer.
If you later size any position, do it from cash risk with a written invalidation — not from the height of the first USD candle. The lot calculator guide is the arithmetic page; this page is the reading page.
Comments
Add a useful note for other traders. We review comments before publishing.