
- Table 2 bands are historical RMSE, not FOMC votes
- Plus-or-minus one RMSE is about 70 percent coverage only under stated assumptions
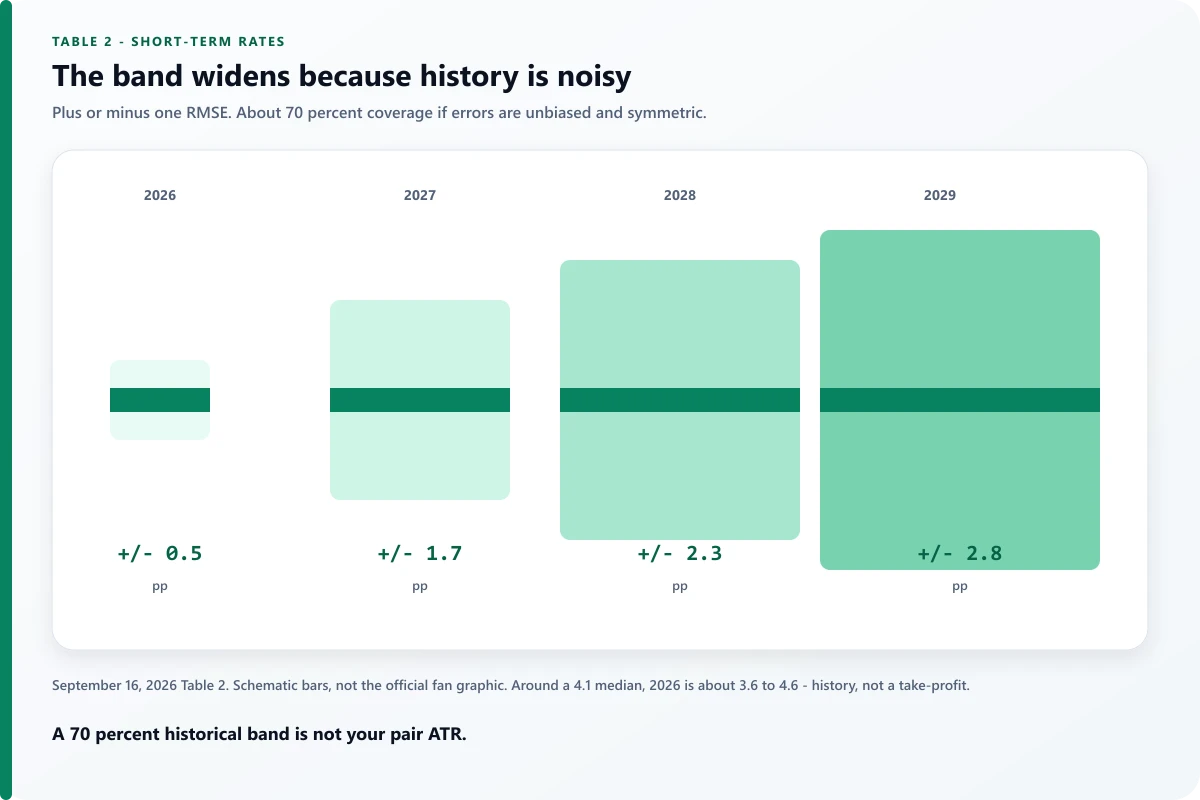
- September 2026 short-rate bands: ±0.5, ±1.7, ±2.3, ±2.8 pp for 2026–29
- The fan is wider than the participant range; the SEP says so
- Dots are appropriate-policy sketches, not modal outcome forecasts
- Do not fade 4.1 because 3.6 sits inside the fan

Affiliate & risk disclosure: ForexTradeLab may earn a commission from qualifying broker links. See the affiliate disclosure and risk disclaimer.
Risk warning: Historical RMSE bands are not trade levels. This page is SEP methodology, not a USD fade of the September 2026 4.1 percent median and not a forecast of 2027.
Quick Answer#
Short Answer
The SEP fan is ±1 historical RMSE around the median projection. The Fed says that interval is about a 70 percent band if past errors are a fair guide and are roughly symmetric. It is not a take-profit, not the dot-plot range, and not a Committee vote.
Detailed Explanation
The Guide to the SEP and the Forecast Uncertainty box on the 16 September 2026 projections page define Table 2: plus-or-minus the root mean squared error of fall projections made over the previous 20 years by various private and government forecasters. The cited method paper is Reifschneider and Tulip, FEDS 2017-020.
Read this after the dot-plot guide. The dots tell you where people sat this meeting. The fan tells you how wrong similar forecasts have been.
Example
Median 2026 funds rate = 4.1. Table 2 short-rate error for 2026 = ±0.5. The schematic band is about 3.6 to 4.6. That is an interest-rate error interval. It is not EUR/USD at 1.08–1.12.
Common Mistake
Shorting USD because “the fan goes down to 3.6, so they will cut.”
Professional Tip
Write “historical RMSE, not a path” on the screenshot before you tweet it.
What Table 2 Actually Is#
Short Answer
Table 2 is a ruler. The fan chart is that ruler laid on the median.
Detailed Explanation
September 2026 Table 2, short-term interest rates, plus or minus, in percentage points:
| Year | RMSE band |
|---|---|
| 2026 | ±0.5 |
| 2027 | ±1.7 |
| 2028 | ±2.3 |
| 2029 | ±2.8 |
Other official 2026 rows: GDP ±1.4; unemployment ±0.5; consumer prices ±1.0. The note says errors use projections for 2006 through 2025 released in the fall. The 70 percent language is conditional: unbiased, symmetric errors, past average size. The same box says current conditions may differ from that 20-year average.
Figure 5’s funds-rate note is the sentence desks skip: the confidence interval is not strictly consistent with the funds-rate projections, because those projections are appropriate-policy assessments, not forecasts of the likeliest quarterly funds-rate outcomes. The fan is still published as a broad sense of uncertainty.
If the interval would run below zero, the Fed’s convention is to truncate at zero — the bottom of the lowest target range the Committee has used. That is a charting rule, not a promise about negative rates.
Example
A 2029 ±2.8 band around a 3.6 median is 0.8 to 6.4 before any truncation talk. That is not a 2029 trading range for USD/JPY.
Common Mistake
Treating later-year fans as more “precise” because the median looks smooth. The ruler widens.
Professional Tip
If you keep one Table 2 number next to the 2026 median, keep ±0.5. If you keep one next to 2027, keep ±1.7. Do not mix them.
People-Disagreement Is Not History#
Short Answer
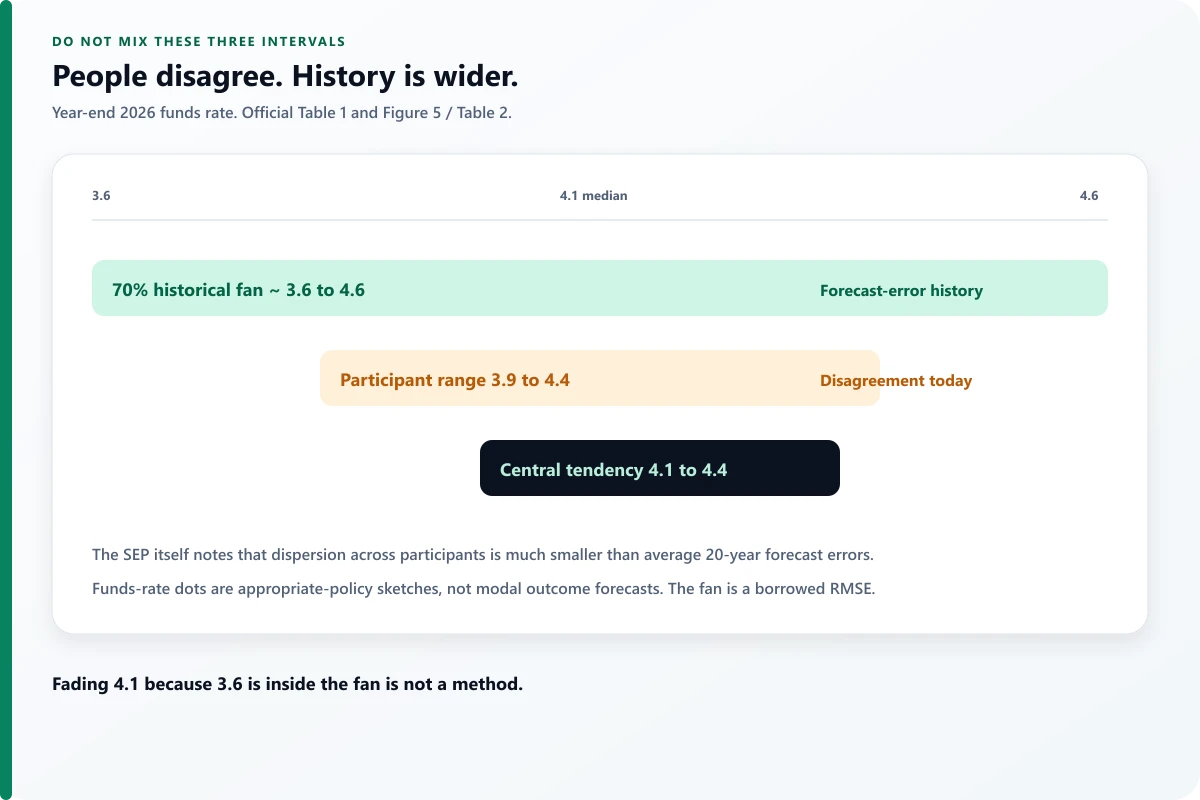
Range = today’s 18 people. Fan = 20 years of other people’s forecast errors. The SEP says the first is much smaller than the second.
Detailed Explanation
Year-end 2026 funds rate, 16 September 2026:
| Object | Interval | Meaning |
|---|---|---|
| Median | 4.1 | Middle appropriate-policy midpoint |
| Central tendency | 4.1–4.4 | Drops three highest and three lowest |
| Participant range | 3.9–4.4 | Every submitted midpoint |
| Historical fan (schematic) | ~3.6–4.6 | 4.1 ± 0.5 |
The Forecast Uncertainty box is explicit: compare Figure 1 (dispersion across participants) with the fan charts; dispersion across participants is much smaller than average forecast errors over the past 20 years. Using 3.9–4.4 as if it were a 70 percent outcome band understates historical uncertainty. Using 3.6–4.6 as if it were a vote overstates today’s disagreement.
Qualitative boxes sit beside the fans. September 2026: 17 of 18 participants judged PCE-inflation uncertainty higher than the 20-year norm and weighted PCE risks to the upside. That is not a second fan. It is a tilt the symmetric historical band does not show.
Example
You say “everyone is between 3.9 and 4.4, so 3.6 is impossible.” Table 2 and the SEP’s own comparison say you mixed objects.
Common Mistake
Drawing the participant range on a EUR chart and calling it a fan.
Professional Tip
In the journal, one line for the median, one for the range, one for “fan ±X — not a trade.”
Why FX Desks Still Glance at It#
Short Answer
The fan is a humility tool. It is not a setup.
Detailed Explanation
A tidy 4.1 median next to a ±0.5 current-year band, and a ±1.7 next-year band, is why you do not treat dots as a calendar. It is also why a priced-in hold can still be followed by a year that lands outside this year’s median. Humility is not a short USD ticket.
EUR still prices surprise versus the path, and versus the ECB. A wide fan does not cancel a 14:00 Eastern spread event. Stops still slip. Stay flat if the cash limit fails.
The ECB’s staff scenarios around an energy shock are a different product: assumed intensities, not Table 2 RMSE. Do not paste a Fed fan onto HICP.
Example
You fade EUR/USD because “Fed funds can be 3.6 inside the fan.” The fan did not price the ECB 10 September hike or the next CPI. You used a ruler as a crystal ball.
Common Mistake
Building an EA that fades the median toward the lower fan edge.
Professional Tip
If the only sentence you can write is “we are inside the 70 percent band,” you are describing every typical year. That is not a trigger. Size any later idea from cash risk with the lot calculator.
A Worked Read — 16 September 2026#
Short Answer
Median 4.1, fan about 3.6–4.6 this year, participant range 3.9–4.4, inflation uncertainty judged higher than history. Three facts. Zero permission to fade.
Detailed Explanation
Official package that day: hike to 3.75–4.00%, SEP median path 4.1 / 4.1 / 3.9 / 3.6, longer-run 3.2. Table 2 short-rate ruler as above. Qualitative inflation uncertainty: 17 of 18 “higher.” Your job on the December SEP is to repeat the three-object test, not to keep 3.6–4.6 as a pet range.
Example
Notebook: “Median 4.1. Range 3.9–4.4. Fan ±0.5. Qual: inflation upside. Priced path: ___. Stay-flat: yes/no.” Empty priced-path blank = no trade.
Common Mistake
Screenshotting only the pretty fan and dropping Table 2.
Professional Tip
Save the accessible HTML. Social redraws drop the footnote that funds-rate projections are not modal outcome forecasts.
Key Takeaways#
- Fan = historical RMSE on the median.
- ~70 percent is an assumption, not a guarantee.
- The ruler widens with horizon.
- Range ≠ fan.
- Dots ≠ likeliest-rate forecasts.
- Inside the fan is not a setup.
Glossary#
- RMSE: Root mean squared error of past forecasts — Table 2’s unit.
- Fan chart: Median plus/minus those RMSEs (and a truncation rule at zero for the funds rate).
- 70 percent band: Approximate coverage if errors are unbiased and symmetric.
- Participant range: Lowest to highest dots today.
- Appropriate policy: What each person thinks the funds rate should be — Figure 5’s caution.
Checklist#
- Official SEP open.
- Table 2 copied for the variable/year.
- Band added to the median and labelled “history.”
- Figure 1 range written on a different line.
- Qualitative uncertainty/risk boxes glanced at.
- No take-profit placed on the fan edge.
- Priced-path sentence present before any click.
Future related articles#
- How ECB staff scenarios differ from SEP fans
- How to read inflation-uncertainty diffusion indexes without a story
- Why symmetry is a bad assumption near the zero lower bound (the paper’s own caveat)
Comments
Add a useful note for other traders. We review comments before publishing.