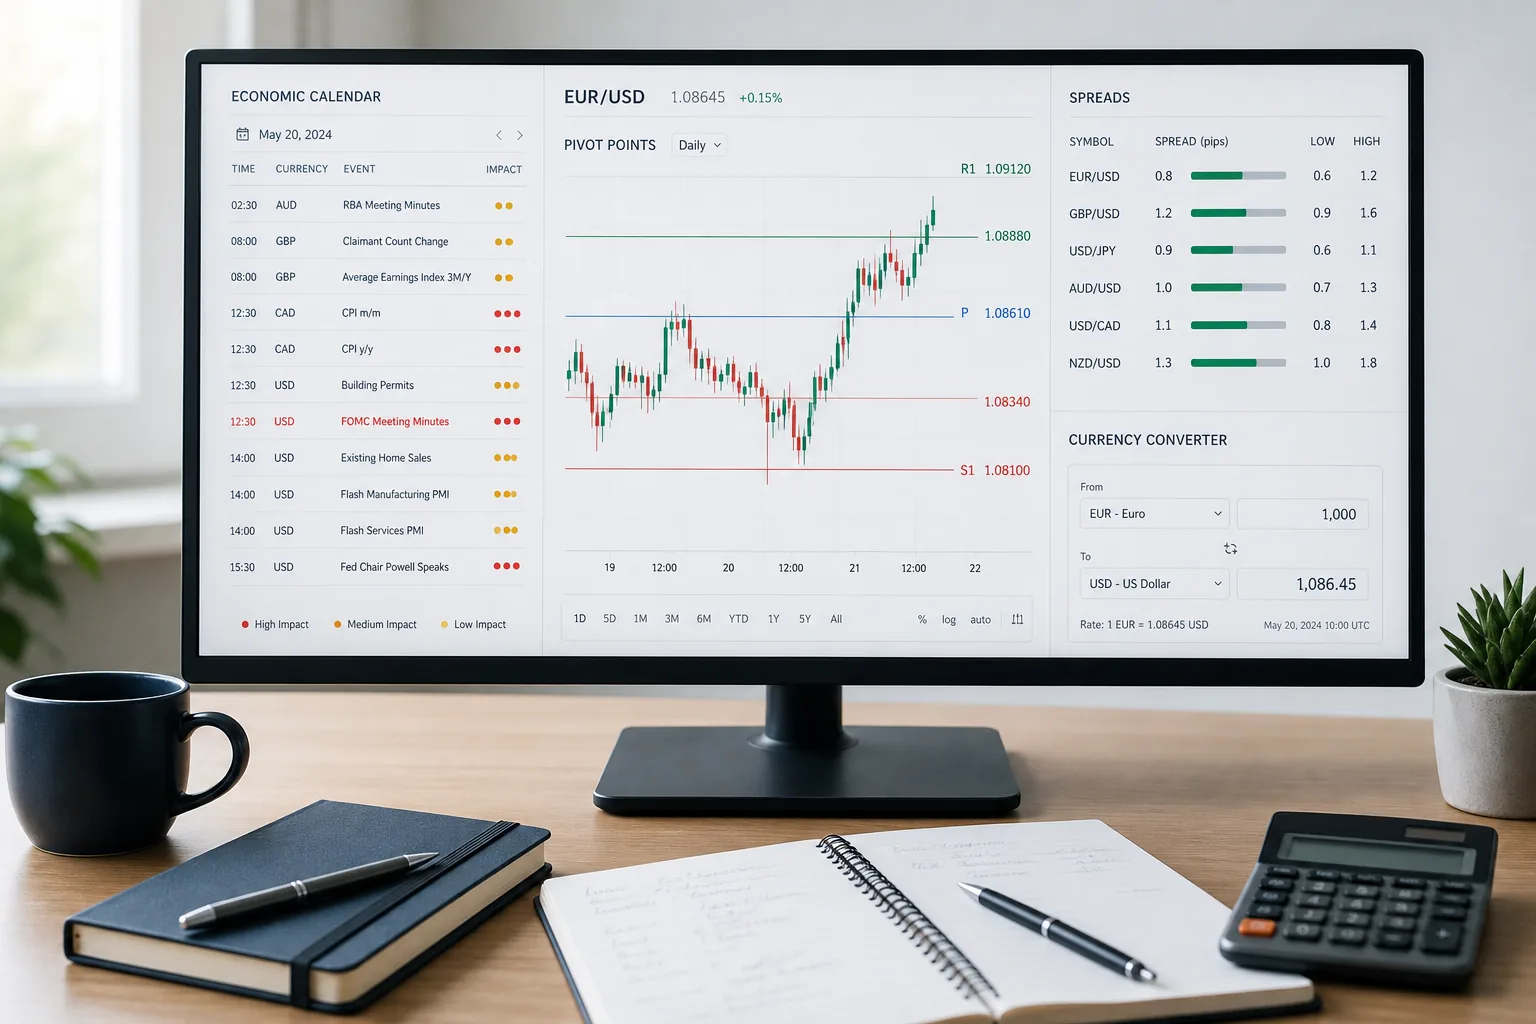
- Pivot calculator needs prior high/low/close — garbage OHLC in, garbage levels out
- Economic calendar is for timing risk, not automatic entries
- Converter shows mid-market context; banks add markup
- Spread tracker helps you avoid paying the wrong session premium
- Combine these with the lot and P/L calculators before live orders
- Quick Decision Framework
- Short Answer
- Detailed Explanation
- Example
- Common Mistake
- Professional Tip
- TL;DR — Analysis Tools vs Money Tools
- Tool 1 — Pivot Point Calculator (Detailed Usage)
- What you enter
- Step-by-step
- How pivots pair with other tools
- Pivot calculator mistakes
- Tool 2 — Economic Calendar (Detailed Usage)
- What to look at
- Practical routine
- What the calendar is not
- Tool 3 — Currency Converter (Detailed Usage)
- When traders use it
- Step-by-step
- Converter pitfalls
- Tool 4 — Spread Tracker (Detailed Usage)
- Why spreads belong in the plan
- How to use it before entry
- Full Pre-Session Stack (All ForexTradeLab Tools)
- Risk Warning
Quick Decision Framework#
Short Answer
Use the pivot calculator for structure, the economic calendar to avoid blind news risk, the converter for currency context, and the spread tracker for session cost — then size with the lot calculator. Pivots need a completed high/low/close. The calendar is a timing filter, not an entry bot.
Detailed Explanation
Garbage OHLC in means garbage R1/S1 out — always take the finished candle, not the one still printing. Daily pivots suit intraday; weekly pivots suit swings. The converter shows mid-market context; banks and cards add markup on real cash. The spread tracker stops you paying a dead-session premium you did not budget. Combine these with lot and P/L tools so a bounce idea at S1 still has a stop beyond invalidation and a dollar cap.
Example
You copy yesterday’s EUR/USD H/L/C, generate P and S1–R3, and plan a long only if price holds pivot with a stop beyond S1. The calendar shows CPI in 20 minutes — you stand aside. The spread tracker shows 2.8 pips versus a usual 1.1, so even after CPI you wait. Lot size is $20 risk on a 25-pip stop, not “0.10 because S1 looks strong.”
Common Mistake
Entering a forming candle’s high/low into the pivot tool, or treating a red calendar folder as an automatic market order.
Professional Tip
Before the session, generate pivots from the last completed bar, mark the day’s high-impact prints, check live spread versus your stop, then run the lot calculator. If any step is skipped, do not trade the level.
TL;DR — Analysis Tools vs Money Tools#
Short Answer
Use the pivot calculator for structure levels, the economic calendar to avoid blind news risk, the converter for currency context, and the spread tracker to check trading costs — then size the trade with the lot calculator.
Common Mistake
Economic calendar is for timing risk, not automatic entries
Professional Tip
Converter shows mid-market context; banks add markup
| Job | Tool |
|---|---|
| Structure levels | Pivot point calculator |
| Event timing | Economic calendar |
| Currency context | Currency converter |
| Cost awareness | Forex spread tracker |
| Position risk | Lot calculator + P/L calculator |
This guide covers the first four in depth. For lot/pip/P&L field-by-field usage, use the companion lot, pip & profit/loss handbook.
Tool 1 — Pivot Point Calculator (Detailed Usage)#
Open: Pivot Point Calculator
What you enter#
| Input | Where to get it |
|---|---|
| Prior period high | Yesterday’s (or prior H4/D1) high |
| Prior period low | Same period low |
| Prior period close | Same period close |
| Formula type (if offered) | Standard / Fibonacci / Camarilla — pick one and stick to it |
Rule: OHLC must come from the same session definition your chart uses (broker server time vs exchange midnight). Mixed sessions produce levels that never match the chart.
Step-by-step#
- Decide the timeframe: daily pivots for intraday; weekly for swing.
- Copy H/L/C from the completed candle — not the forming one.
- Generate pivot (P), R1–R3, S1–S3.
- Plot or note levels on MT5.
- Plan: bounce/reject zones are ideas, not orders.
- Size any trade with the lot calculator using a stop beyond the invalidation level (for example beyond S1 if long from pivot).
How pivots pair with other tools#
- Before London open, check the economic calendar for rate decisions that can blow through R2/S2.
- Preview upside/downside with the profit/loss calculator using R1/R2 as TP candidates.
- For classic S/R thinking: support and resistance guide.
Pivot calculator mistakes#
| Mistake | Fix |
|---|---|
| Using today’s incomplete candle | Wait for the period to close |
| Switching formulas mid-week | Stay consistent for comparison |
| Treating R3 as a guaranteed target | Treat outer levels as low-probability extensions |
| No stop past structure | Always define invalidation in price |
Tool 2 — Economic Calendar (Detailed Usage)#
Open: Economic Calendar
What to look at#
| Column | Trader use |
|---|---|
| Time (local) | Know when liquidity can gap |
| Currency | Which pairs may spike (USD → EUR/USD, XAU/USD, indices) |
| Impact | Red/high = widest spreads & slippage risk |
| Forecast vs previous | Surprise potential — not a direction oracle |
Practical routine#
- Each Sunday (or daily pre-session): scan the week’s red events.
- Mark FOMC, NFP, CPI, ECB, and your local central bank if you trade regional pairs.
- Decide: flat, reduce size, or trade only after the first impulse settles.
- If you still trade, re-check spreads on the spread tracker and re-size with the lot calculator.
Deeper calendar literacy:
What the calendar is not#
It does not tell you “buy USD”. It tells you when the market’s noise distribution changes. Combining news timing with gold macro context: what moves financial markets.
Tool 3 — Currency Converter (Detailed Usage)#
Open: Currency Converter
When traders use it#
- Account in USD, expenses in EGP/SAR/PKR/NGN — convert withdrawal planning figures
- Comparing deposit sizes across base currencies
- Quick mid-market context before reading a broker’s conversion fee
Step-by-step#
- Choose base → quote on the converter hub (for example USD → your local currency).
- Enter the amount you care about (deposit, withdrawal, P/L).
- Treat the rate as mid-market, not the cash desk rate.
- For trading costs, still check the broker’s conversion markup separately.
Related country-aware calculator posts (if you trade those markets): pip calculator India, lot size calculator Pakistan, forex calculator Nigeria.
Converter pitfalls#
- Using mid rates to assume bank payout
- Forgetting weekend gaps between FX and your local cash market
- Confusing converter output with a pip value (use the pip value calculator for that)
Tool 4 — Spread Tracker (Detailed Usage)#
Open: Forex Spread Tracker
Why spreads belong in the plan#
A 0.2-pip strategy on a 1.5-pip night spread is a different business. The tracker helps you see when a pair is expensive to trade.
How to use it before entry#
- Note your pair and session (Asia / London / NY).
- Compare typical spread vs your stop distance — if spread is a large fraction of the stop, skip or wait.
- Re-run P/L calculator with a wider effective cost.
- Scalpers: prefer peak liquidity windows; see also what is scalping.
Broker cost context across firms: broker comparison hub and how we review brokers.
Full Pre-Session Stack (All ForexTradeLab Tools)#
- Economic calendar — any red events in your window?
- Pivot calculator — mark P/R/S for the day.
- Spread tracker — is the pair tradable now?
- Converter — if you need deposit/withdrawal currency context.
- Lot calculator — size from equity + stop.
- Pip value calculator — confirm non-USD/gold math.
- Profit/loss calculator — confirm R before you click.
Tools index: all trading tools.
Risk Warning#
Forex and CFDs are high-risk leveraged products. Tools on ForexTradeLab are educational and do not provide investment advice or trade signals. Read the disclaimer and FAQ before live trading.

Comments
Add a useful note for other traders. We review comments before publishing.