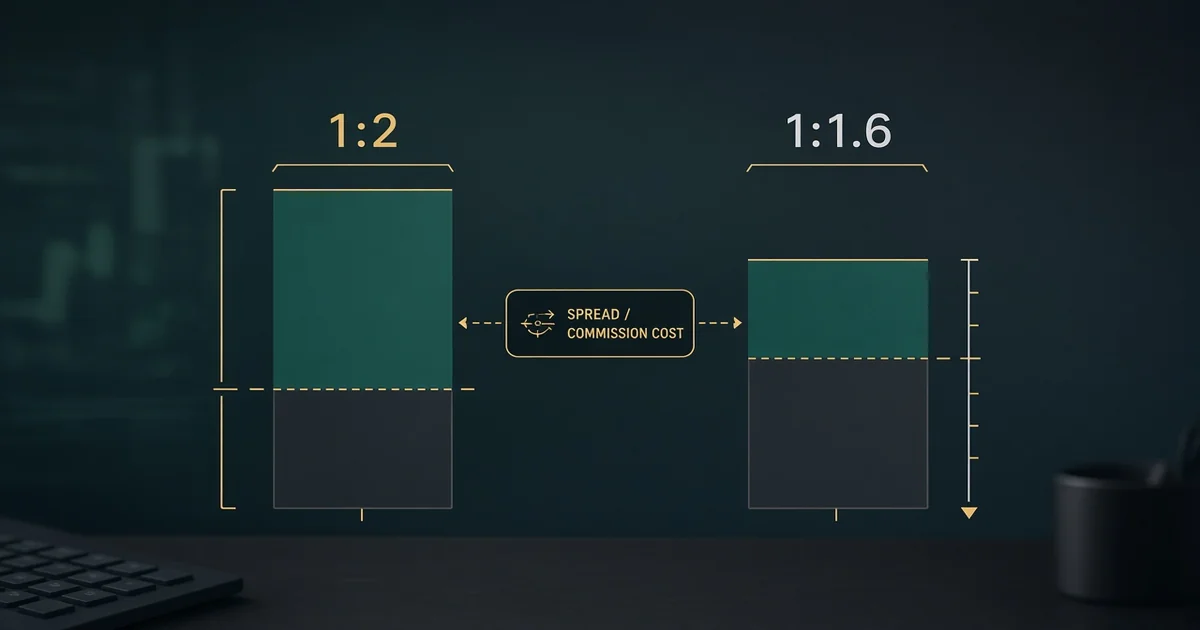
- Chart R:R measures stop and target distance; cost-adjusted R:R subtracts round-turn cost from the winner and adds it to the loser
- Net R:R ≈ (Target − Cost) ÷ (Stop + Cost)
- A clean 40/20 pip plan with 1.5 pips of round-turn cost is about 1.79:1, not 2:1
- Break-even win rate rises when net R:R falls — scalpers feel this first
- If cost is a large share of your stop, the chart ratio is marketing, not a trade plan
 Regulated Global Broker
Trusted by 20M+ traders — open your account in minutes
- Trade 1,400+ instruments
- Country-based bonus offers where eligible
- MT4 & MT5 available
- Easy deposits and withdrawals
- Leverage up to 1000:1, where available
- Copy Trading: auto-copy expert strategy managers

Open a free Exness demo
- Practice with virtual funds before you deposit
- Spreads from 0.0 by account type
- MT4, MT5 and the Exness app
- 800K+ active clients
- Automated withdrawals; arrival time still varies
- Confirm the legal entity before you fund
- Withdrawals are requested in the client area; arrival time varies
- Fund a live account only after the demo is clear
- Quick Decision Framework
- Short Answer
- Detailed Explanation
- Example
- Common Mistake
- Professional Tip
- What chart R:R quietly leaves out
- Short Answer
- Detailed Explanation
- Example
- Common Mistake
- Professional Tip
- The formula you can check by hand
- Short Answer
- Detailed Explanation
- Example
- Common Mistake
- Professional Tip
- Worked EUR/USD ladder
- Short Answer
- Detailed Explanation
- Example
- Common Mistake
- Professional Tip
- Scalping is where the math gets rude
- Short Answer
- Detailed Explanation
- Example
- Common Mistake
- Professional Tip
- Gold and crosses need their own pip value
- Short Answer
- Detailed Explanation
- Example
- Common Mistake
- Professional Tip
- How this changes the break-even story
- Short Answer
- Detailed Explanation
- Example
- Common Mistake
- Professional Tip
- Checklist
- Mini glossary
- Key takeaways
- Where this leaves the decision
Affiliate disclosure: ForexTradeLab may earn a commission from partner broker links, at no added cost to you. Read our affiliate disclosure.
Quick Decision Framework#
Short Answer
Chart risk-reward is stop distance versus target distance. Cost-adjusted risk-reward folds round-turn spread and commission into that same pip math: (Target − Cost) ÷ (Stop + Cost). A 40/20 plan with 1.5 pips of cost is about 1.79:1, not 2:1.
Detailed Explanation
Every fill pays a toll before the idea can be right. On majors that toll is usually a few tenths to a couple of pips once you convert commission. On thin crosses, gold around news, or late Asia, it can be worse. The chart still draws a neat 1:2. The account does not. ESMA's CFD work also noted that leverage amplifies the bite of transaction costs for retail clients — which is why small stops and high frequency are where this distortion shows up first.
Example
Stop 20 pips, target 40 pips, round-turn cost 1.5 pips:
| Measure | Value |
|---|---|
| Chart R:R | 40 ÷ 20 = 2.00 |
| Net reward | 40 − 1.5 = 38.5 |
| Net risk | 20 + 1.5 = 21.5 |
| Cost-adjusted R:R | 38.5 ÷ 21.5 ≈ 1.79 |
| Chart break-even win rate | 1 ÷ (1+2) = 33.3% |
| Cost-adjusted break-even | 1 ÷ (1+1.79) ≈ 35.8% |
Two and a half percentage points does not sound dramatic until you run 200 trades a month.
Common Mistake
Calling a trade "1:2" because the lines on the chart are 20 and 40 pips apart, then wondering why a 40% win rate still bleeds.
Professional Tip
Keep a one-line field in the journal: cost in pips. Without it, expectancy and R:R are theatre.
Risk warning: Forex and CFDs are leveraged products. Most retail CFD accounts lose money at firms that publish the standardised outcome warning. These examples are arithmetic for education, not a signal to trade. Read the risk disclaimer.
What chart R:R quietly leaves out#
Short Answer
Chart R:R counts price distance. It does not count the money that leaves the account because you opened and closed.
Detailed Explanation
On a long, you buy the ask and later sell the bid. The spread is already a headwind at entry. Commission, if your account type charges it, is a second line on the statement. Slippage is the third — not a fee, but still cash. The all-in trading costs framework is the inventory list; this article is the ratio that comes after you total that inventory for one round trip.
BIS survey data reminds us the underlying FX market is huge and fragmented — April 2025 OTC FX turnover ran near $9.6 trillion a day on the Triennial Survey — but your retail CFD ticket still clears through one broker's book. Your cost is that book's spread, commission and fill quality, not the global average.
Example
Teaching quote on EUR/USD, 1.00 lot, USD account, pip value ≈ $10:
| Cost piece | Teaching figure | Pip equivalent |
|---|---|---|
| Spread at entry | 1.2 pips | 1.2 |
| Round-turn commission | $7 | 0.7 |
| Slippage buffer (optional) | $0 this table | 0.0 |
| Round-turn cost | 1.9 |
Replace these with your median numbers from a normal London–New York overlap session. Marketing "from 0.0" is not a median.
Common Mistake
Using the broker's best advertised spread as the cost input for every backtest bar.
Professional Tip
For strategy work, use a median cost and a stressed cost (news or thin hours). One number is a hope; two numbers are a plan.
The formula you can check by hand#
Short Answer
Net R:R = (Target − Cost) ÷ (Stop + Cost), with Target, Stop and Cost in the same unit.
Detailed Explanation
Why add cost to the stop and subtract it from the target? Because a full loser still paid the toll, and a full winner still paid the toll. Putting the whole round-turn cost on both sides is a conservative teaching model. Some desks allocate half the spread to each side; the ranking of setups barely changes if you stay consistent.
Break-even win rate before other noise:
Break-even win rate ≈ 1 / (1 + Net R:R)
That sits next to the expectancy math in Forex expectancy, win rate and risk-reward. Expectancy asks whether the average trade pays. Cost-adjusted R:R asks whether the shape of each trade still matches the story you told yourself on the chart.
Example
Three teaching plans, same 1.5-pip cost:
| Chart stop | Chart target | Chart R:R | Net R:R | Break-even win rate |
|---|---|---|---|---|
| 40 | 80 | 2.00 | 1.89 | ~34.6% |
| 20 | 40 | 2.00 | 1.79 | ~35.8% |
| 10 | 20 | 2.00 | 1.61 | ~38.3% |
| 8 | 8 | 1.00 | 0.68 | ~59.5% |
Same "1:2" label. Different jobs once cost is honest.
Common Mistake
Comparing a 10-pip scalping R:R to a 40-pip swing R:R without normalising for cost share.
Professional Tip
If Cost ÷ Stop is above about 0.15, treat the chart ratio as decoration until you widen the stop, cut size, or change the cost structure.
Worked EUR/USD ladder#
Short Answer
Here is one ticket you can recompute on paper in under a minute.
Detailed Explanation
Assume:
- Account currency: USD
- Volume: 0.10 lot (pip value ≈ $1)
- Entry idea: long EUR/USD
- Stop: 25 pips from fill
- Target: 50 pips from fill
- Measured round-turn cost: 1.4 pips (spread + commission in pip terms)
Cash risk at the stop, before reframing cost: 25 × $1 = $25. That is the number the 1% risk rule cares about first. Cost-adjusted R:R does not replace position sizing; it stress-tests whether the reward side still justifies that cash risk.
Example
| Step | Calculation | Result |
|---|---|---|
| Chart R:R | 50 ÷ 25 | 2.00 |
| Net reward | 50 − 1.4 | 48.6 pips |
| Net risk | 25 + 1.4 | 26.4 pips |
| Net R:R | 48.6 ÷ 26.4 | ≈ 1.84 |
| Break-even win rate | 1 ÷ (1 + 1.84) | ≈ 35.2% |
| Net reward in cash | 48.6 × $1 | $48.60 |
| Net risk in cash | 26.4 × $1 | $26.40 |
If your journal win rate on this setup is 32% after 80 trades, the chart said you were fine. The cost-adjusted line says you are underwater before psychology even enters.
Common Mistake
Sizing the lot from chart R:R, then celebrating a green ticket that only recovered the spread.
Professional Tip
When you move a stop to "break-even," use the flat-price definition that includes costs. A stop parked on the wrong side of the fill is another silent tax on R:R.
Scalping is where the math gets rude#
Short Answer
The smaller the stop, the larger the cost as a fraction of risk — and the higher the win rate you need just to stand still.
Detailed Explanation
Take an 8-pip stop and 12-pip target (chart R:R = 1.5). With 1.5 pips of round-turn cost:
- Net reward = 10.5
- Net risk = 9.5
- Net R:R ≈ 1.11
- Break-even win rate ≈ 47.4%
Drop the target to 8 pips because "it always comes back," and net R:R falls to 0.68, with break-even near 60%. That is not a personality problem. It is arithmetic. Raw or ECN-style books can help only if the all-in pip cost actually falls after commission — compare accounts the way the all-in cost guide describes, not by the tightest banner.
Example
| Style | Stop | Target | Cost | Net R:R | BE win rate |
|---|---|---|---|---|---|
| Swing teaching | 50 | 100 | 1.5 | 1.91 | ~34.4% |
| Intraday | 20 | 30 | 1.5 | 1.33 | ~42.9% |
| Scalp | 8 | 12 | 1.5 | 1.11 | ~47.4% |
| Scratch scalp | 8 | 8 | 1.5 | 0.68 | ~59.5% |
Common Mistake
Raising frequency to "make the edge show up faster" while the net R:R is already below 1.
Professional Tip
If you cannot state your median cost in pips without opening a marketing page, you are not ready to judge a scalping model.
Gold and crosses need their own pip value#
Short Answer
The formula stays. The pip or point value changes. Do not paste EUR/USD $10-per-lot habits onto XAU/USD or EUR/GBP.
Detailed Explanation
On gold, brokers quote ticks and contract sizes differently. On a cross, pip value in a USD account also depends on the quote currency conversion. Wrong pip value → wrong cost in pips → fake net R:R. Use the symbol specification or the lot calculator, then convert commission with that value. For gold sizing context see gold lot size calculation.
Example
Suppose gold tick value on your volume is $1 per $0.10 move, and round-turn commission plus spread equals $8. That is 0.80 in "$0.10 units." If the stop is 50 of those units and the target is 100, net R:R = (100 − 0.8) ÷ (50 + 0.8) ≈ 1.95. Chart still said 2.00 — fine. Shrink the stop to 15 units with the same $8 cost and net R:R becomes (30 − 0.8) ÷ (15 + 0.8) ≈ 1.85 on a 2.00 chart label… until the spread widens to $20 around NFP and the same stop prints a very different ratio.
Common Mistake
Ignoring that gold spreads widen harder than EUR/USD in the same news window.
Professional Tip
Log gold costs in account currency, then convert. Pip language on gold starts arguments; cash does not.
How this changes the break-even story#
Short Answer
Lower net R:R means a higher fraction of trades must win just to finish flat.
Detailed Explanation
| Net R:R | Approx. break-even win rate |
|---|---|
| 3.00 | 25.0% |
| 2.00 | 33.3% |
| 1.79 | 35.8% |
| 1.50 | 40.0% |
| 1.00 | 50.0% |
| 0.70 | 58.8% |
Regulators require CFD firms to show retail loss-rate warnings for a reason. Cost drag is not the only reason accounts go negative — leverage, oversizing and news gaps do more damage — but cost drag is the part you can measure before the next click. The FCA CFD page and ESMA's product intervention materials are the policy backdrop; your statement is the personal one.
Example
You believe you win 38% of a 1:2 chart system. After costs the system is 1.6:1. Break-even sits near 38.5%. You are not "almost there." You are on the wrong side of flat until either win rate rises, cost falls, or targets widen without inventing stops.
Common Mistake
Improving win rate by cutting winners early, which knocks net R:R down further and chases its own tail.
Professional Tip
Fix cost and stop distance before you hunt for a higher win rate. Win rate is the noisiest of the three dials.
Checklist#
- Stop and target measured from the fill, not from memory of the candle.
- Round-turn cost listed: spread + commission (+ swap if held) (+ slippage buffer if earned).
- Cost converted with the correct pip or tick value for that symbol and volume.
- Net R:R computed as (Target − Cost) ÷ (Stop + Cost).
- Break-even win rate written next to the journal win rate.
- Cost ÷ Stop checked; large ratios flagged as scalping-fragile.
- Account type compared on all-in pip cost, not on "from 0.0" alone.
- Gold and crosses recalculated; EUR/USD shortcuts not reused.
- At least 50 closed trades before calling the net R:R stable.
- Position size still capped by cash risk rules in risk management.
Mini glossary#
| Term | Meaning here |
|---|---|
| Chart R:R | Target pips ÷ stop pips from the fill |
| Round-turn cost | Full cost to open and close, in pips or cash |
| Cost-adjusted R:R | (Target − Cost) ÷ (Stop + Cost) |
| Break-even win rate | Approx. 1 ÷ (1 + Net R:R) |
| Cost share | Cost ÷ Stop — how much of risk is toll |
| Pip value | Account-currency value of one pip at your volume |
Key takeaways#
- A chart 1:2 is a drawing. A cost-adjusted 1:2 is a claim about money.
- Net R:R = (Target − Cost) ÷ (Stop + Cost) is enough arithmetic for most tickets.
- The same chart label gets worse as stops shrink, because cost is a larger share of risk.
- Break-even win rate rises when net R:R falls; scalpers feel it first.
- Measure median and stressed costs from your own book before you trust a backtest.
Where this leaves the decision#
If the cost-adjusted ratio no longer supports the win rate you actually produce, change the plan — wider invalidation, fewer trades, cheaper all-in account structure, or no trade. Do not raise lot size to "catch up."
For sizing discipline stay with the 1% risk rule examples and the position size lot calculator guide. For the inventory of fees use all-in trading costs. If you later open a live account, verify the live spread and commission on the entity that would hold your funds — for example via XM — and recompute this ladder with those numbers. Eligibility depends on your country.
Worth writing next as separate pieces: partial-close scale-out math after the first take-profit, and how to audit median spread paid from an MT5 HTML statement.
Comments
Add a useful note for other traders. We review comments before publishing.