- Risk of ruin is the probability that a losing streak will wipe out your account before your edge can recover
- It rises sharply as risk per trade increases — 2–3% per trade is often survivable on paper but lethal in real variance
- Win rate alone is meaningless without reward-to-risk and position size
- Most 'compounding plans' fail because they assume fixed monthly returns and ignore ruin math
- Serious traders size so that a 10–15 trade losing streak is painful but not terminal
June 2026 field note: These are educational estimates, not guarantees. Real forex returns are not independent coin flips — correlation, regime change and execution slippage all matter. Use ruin math to stress-test sizing, not to predict exact probabilities.
Quick Answer#
Forex risk of ruin answers one question: If I keep trading this way, what are the odds a normal losing streak ends my account?
It is a function of:
- Win rate (or edge)
- Reward-to-risk (average win vs average loss)
- Risk per trade (% of equity lost if stopped out)
- Number of trades (horizon)
The uncomfortable truth: you can have a positive expectancy and still be likely to blow up if risk per trade is too high. That is why serious traders obsess over the 1% rule — not because 1% is magic, but because it keeps ruin probability in a range humans can actually survive.
TL;DR — Risk of Ruin at a Glance#
| Variable | What it does |
|---|---|
| Higher risk per trade | Ruin probability rises fast |
| Lower win rate | Needs higher R:R to survive |
| Higher R:R | Can offset lower win rate |
| Longer horizon (more trades) | More exposure to streaks |
| Correlated positions | Acts like higher effective risk |
What Risk of Ruin Actually Means#
In trading literature, risk of ruin (sometimes called risk of drawdown to zero) comes from probability theory applied to repeated bets. Ralph Vince and Van Tharp popularised its use in position sizing — the idea that how much you bet matters as much as whether you win.
For forex traders, "ruin" usually means one of:
- Account balance hits zero (or margin call cascade)
- Equity falls below your psychological or prop-firm floor (e.g. -10% daily, -20% total)
- You stop trading the plan after a drawdown you did not size for
All three are ruin in practice. The math is about whether your sizing lets you stay in the game long enough for edge to matter.
Key distinction: Risk of ruin is not the same as "having a bad month." A bad month with 1% risk per trade might be -8% to -12%. Ruin is when the structure of your sizing makes recovery statistically implausible.
The Three Inputs That Matter Most#
1. Risk per trade (the lever you control)#
This is the percentage of account equity you lose if a trade hits its stop loss.
| Risk per trade | Typical retail use | Ruin sensitivity |
|---|---|---|
| 0.25–0.5% | Conservative / learning | Very low over long samples |
| 1% | Common professional guideline | Low for many reasonable edges |
| 2% | Aggressive but seen in forums | Materially higher streak risk |
| 3–5% | "Growth mode" / revenge sizing | Often lethal over 100+ trades |
Doubling risk per trade does not double ruin probability — it can increase it multiplicatively because losing streaks compound on a smaller remaining base.
2. Win rate without R:R is incomplete#
A 70% win rate sounds impressive. If average losses are three times average wins (poor R:R), expectancy can still be negative. Conversely, a 40% win rate with 1:2 R:R can be profitable — but requires tolerating long losing runs.
Always pair win rate with average reward-to-risk, not with gut feel.
3. Number of trades (time in market)#
Ruin probability rises with exposure. A strategy that looks safe over 50 trades may look dangerous over 500 — because rare streaks become inevitable at scale.
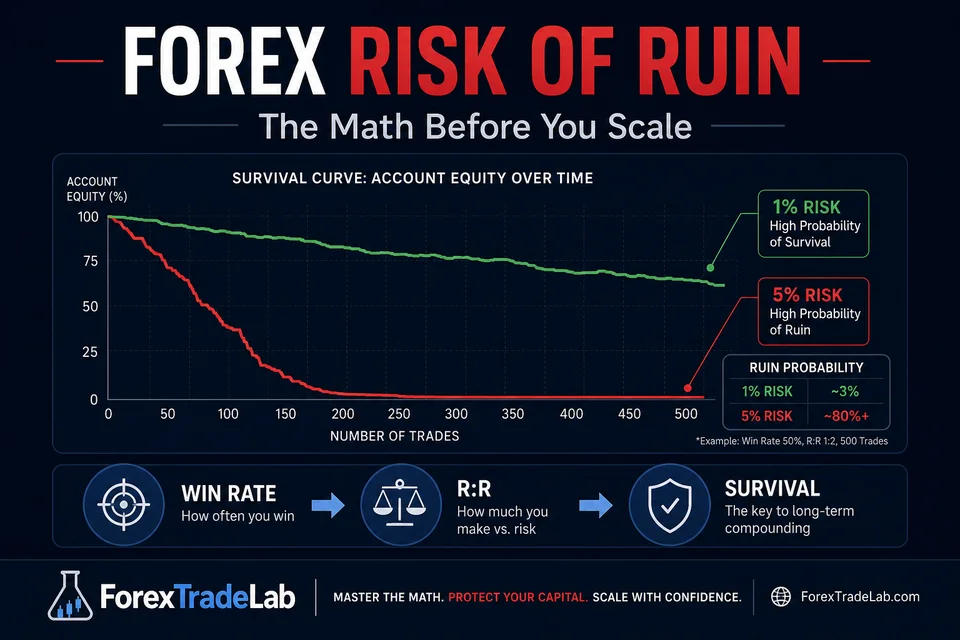
Worked Example: Same Edge, Different Survival#
Assume a simplified model (independent trades, fixed R:R, fixed risk per trade):
- Win rate: 45%
- Reward-to-risk: 1:2 (winners twice the size of losers)
- Horizon: 200 trades
This is a positive expectancy profile. Yet outcomes diverge sharply by sizing:
| Risk per trade | Qualitative ruin risk over 200 trades |
|---|---|
| 0.5% | Low — normal streaks stay manageable |
| 1.0% | Moderate-low — drawdowns hurt but recoverable |
| 2.0% | Elevated — deep drawdowns become likely |
| 4.0% | High — account may not survive full streak distribution |
The edge did not change. Only sizing changed. That is the lesson most compounding spreadsheets omit.
For the compounding angle, see our forex compounding guide — we centre ruin math there deliberately.
A Practical Formula (Simplified)#
Exact closed-form ruin formulas assume independent trials and fixed bet size. Real trading violates both — but the approximation is still useful.
A commonly cited simplified relationship:
Risk of ruin ≈ f(edge, variance, bet size, capital units)
Where edge combines win rate and payoff ratio, and bet size is risk per trade as a fraction of capital.
Traders use online calculators and spreadsheet models (search "risk of ruin calculator trading") to plug in:
- Win %
- Average win / average loss
- Risk % per trade
- Number of trials
You do not need to memorise the formula. You need to internalise the direction: more risk per trade → higher ruin, especially when win rate is under 55% or R:R is under 1:1.5.
Warning: Do not treat spreadsheet ruin = 0.3% as "safe." Models assume static edge. Regime shifts, overtrading and correlated positions can make real ruin faster than the model.
Why Most Scaling Plans Fail Here#
Retail "scale to six figures" plans often assume:
- Fixed +5% or +10% per month
- Reinvesting all profits immediately
- No extended losing streaks
Reality:
- Returns are lumpy, not monthly coupons
- Reinvesting increases absolute risk even at constant %
- Losing streaks of 8–12 trades happen to most systems
When traders respond to drawdown by increasing risk to "make it back," ruin probability jumps — that is not a new strategy, it is a new, worse bet size.
Our pre-trade checklist includes sizing before entry for exactly this reason.
How Serious Traders Use Ruin Math#
Step 1 — Define your ruin level#
Live account: is ruin -50% equity? -100%? Prop firm: is ruin -10% total?
Write it down.
Step 2 — Estimate your real win rate and R:R#
Use last 50–100 trades of the same setup — not your best month.
Step 3 — Plug into a ruin calculator#
Stress-test 0.5%, 1%, 2% risk. See how fast probability climbs.
Step 4 — Size for the streak, not the win#
Ask: Can I survive 10 losses in a row emotionally and financially?
If not, reduce risk or improve R:R before adding capital.
Step 5 — Re-check when you change behaviour#
New session (scalp → swing), new pair cluster, or pyramiding — all change effective risk. Re-run the check.
Risk of Ruin vs Kelly Criterion#
Kelly criterion suggests an optimal bet fraction to maximise long-term growth. Full Kelly is often too aggressive for forex because edge estimates are noisy.
Many traders use fractional Kelly (e.g. half-Kelly) or simply cap at 1% regardless of Kelly output.
Relationship:
- Kelly asks: What maximises growth?
- Ruin math asks: What keeps me alive?
For most retail traders, survival first is the correct priority.
Common Mistakes#
| Mistake | Why it raises ruin risk |
|---|---|
| Risking 3% because "I'm confident" | Confidence is not edge; streaks are blind to confidence |
| Increasing size after wins | Equity curve variance increases effective bet |
| Ignoring correlated trades | Three 1% USD-short bets ≈ one larger bet |
| Using demo win rate on live | Execution, slippage and psychology shrink edge |
| No hard daily loss limit | One bad session can exceed monthly risk budget |
For correlation specifically, read forex correlation and concentration risk.
Bottom Line#
Forex risk of ruin is the bridge between strategy and survival. A workable edge with reckless sizing loses to a mediocre edge with disciplined sizing — over any horizon that matters.
Before you scale capital, upgrade account type, or chase prop firm payouts, answer:
What is my estimated ruin probability at my current risk per trade — and can I survive the losing streak that statistics guarantee?
If the honest answer is no, the fix is not a better indicator. It is smaller risk per trade, better R:R, or fewer correlated positions.
Disclaimer: Educational content only. Forex and CFD trading involve significant risk. Past performance and simplified models do not guarantee future results. See our full risk disclaimer.
Further reading:


Comments
Add a useful note for other traders. We review comments before publishing.