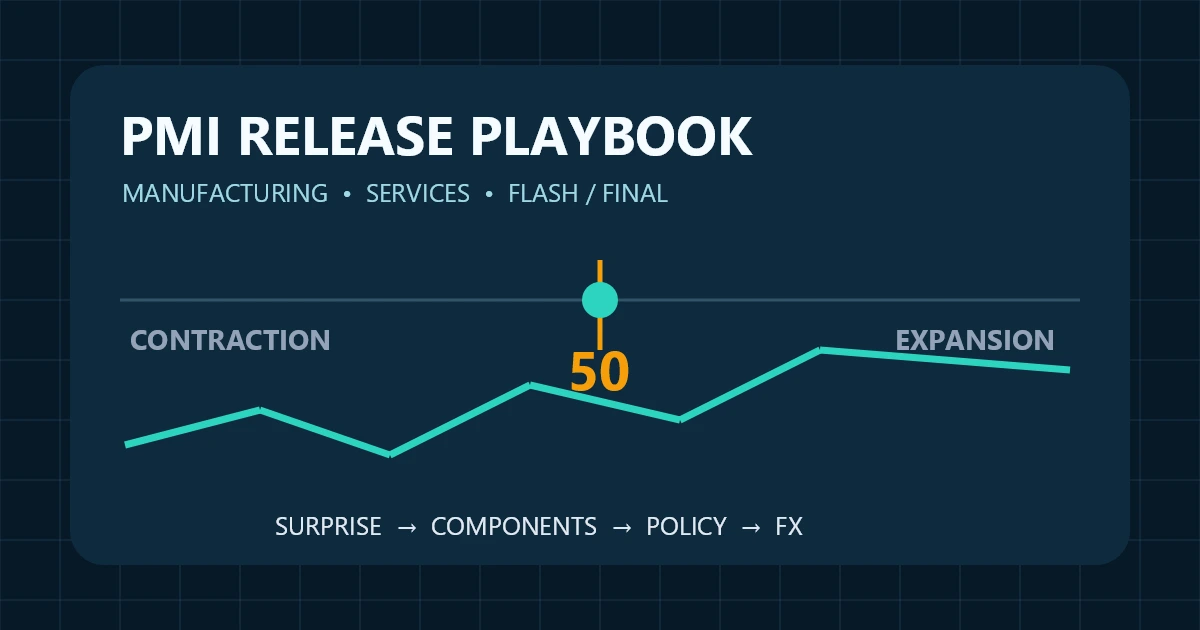
- PMI is a diffusion index, so 55 does not mean 5% economic growth
- Compare the actual release with consensus, prior data, revisions, and market pricing
- Read the headline with new orders, employment, prices, output, and supplier-delivery details
- Above 50 is not automatically bullish and below 50 is not automatically a recession
- Flash estimates can revise and composite PMI is not a simple arithmetic average
- Standing aside is valid when signals conflict or execution conditions are poor
- TL;DR: A Risk-First PMI Playbook
- What PMI Actually Measures
- Short Answer
- Detailed Explanation
- Example
- Common Mistake
- Professional Tip
- The diffusion-index formula
- The 50 Threshold: Useful, but Not a Trading Signal
- Short Answer
- Detailed Explanation
- Manufacturing, Services, and Composite PMI
- Detailed Explanation
- S&P Global PMI vs ISM: Do Not Treat Them as Duplicates
- Short Answer
- Flash vs Final PMI
- Short Answer
- Release Calendar and Time-Zone Cautions
- Actual vs Consensus, Prior, and Revisions
- Short Answer
- A Component-Reading Framework
- How PMI Can Reach Currency Prices
- Mixed-Signal Case Study: July 2026 ISM Services
- Pre-Release, During-Release, and Post-Release Workflow
- Before the release
- During the release
- After the release
- When Not to Trade PMI
- Execution Risks Around PMI
- Practical PMI Checklist
- Glossary
- Build the Wider Fundamental-Analysis Framework
- Final Takeaway
Authoritative source note: Definitions, methodology, and dates should be checked against the S&P Global PMI FAQ, S&P Global PMI methodology page, S&P Global release calendar, and ISM calendar. Economic calendars can mislabel a release or retain an obsolete time.
Affiliate and risk disclosure: ForexTradeLab may receive compensation from selected partners, at no extra cost to you. That does not change our analysis. Leveraged forex can produce rapid losses. PMI does not predict price direction, and news trading can involve wider spreads, slippage, gaps, and stop-loss fills worse than the trigger price. This article is education, not personal investment advice. Review the CFTC retail forex advisory before risking money.
TL;DR: A Risk-First PMI Playbook#
Short answer: A PMI print matters through its surprise, internal composition, revisions, and effect on expected monetary policy—not merely whether it is above or below 50.
- Confirm whether the release is manufacturing, services, composite, flash, or final.
- Compare actual with consensus, prior, and revised prior.
- Read output/business activity, new orders, employment, prices, backlogs, and delivery times together.
- Ask whether the result changes relative growth, inflation, and rate expectations.
- Check yields and related markets before accepting the first currency move.
- Do not trade when the report is internally contradictory, already priced, or execution is disorderly.
Common mistake: Buying a currency because PMI is 52, even though consensus was 54 and the prior reading was revised higher.
Professional tip: Write an upside, downside, mixed, and no-trade scenario before the number. The objective is conditional decision-making, not prediction.
For calendar mechanics, first read how to read an economic calendar and which economic events move markets.
What PMI Actually Measures#
Short Answer
A Purchasing Managers' Index summarizes month-to-month changes reported by surveyed companies. It is timely, survey-based information—not a direct count of output, sales, jobs, or GDP.
Detailed Explanation
Purchasing managers can observe orders, inventories, supplier performance, staffing, and input costs early in the business cycle. Survey providers ask whether a condition improved, was unchanged, or deteriorated compared with the previous month. Responses are aggregated into diffusion indices. S&P Global explains the survey approach and coverage in its PMI FAQ.
PMI is valuable because official hard data often arrive later. The ECB has documented how PMI information can contribute to GDP nowcasting, but “useful for nowcasting” is not “perfectly predicts GDP” and certainly not “predicts the next EUR/USD candle.”
Example
Suppose 35% of respondents report improvement, 40% report no change, and 25% report deterioration. A basic diffusion index is 35 + (0.5 × 40) = 55. That reading does not mean output, profits, or GDP grew 5%; it only means the balance of categorized survey responses produces a diffusion index of 55 under that calculation.
Common Mistake
Treating a PMI reading as a percentage growth rate, or assuming any print above 50 is automatically bullish for the related currency.
Professional Tip
Read the provider's methodology before trading the number. Headline construction, component weights, seasonal adjustment, and sector coverage can differ across S&P Global, ISM, and national releases.
The diffusion-index formula#
For a basic diffusion index:
PMI diffusion index = % reporting improvement + 0.5 × % reporting no change
The 50 Threshold: Useful, but Not a Trading Signal#
Short Answer
In a standard PMI diffusion index, above 50 indicates more expansion than contraction relative to the previous month; below 50 indicates contraction. It does not automatically define recession, currency direction, or trade quality.
Detailed Explanation
Direction and level must be separated:
- A move from 56 to 52 remains above 50 but signals slower expansion.
- A move from 46 to 49 remains below 50 but signals a slower rate of contraction.
- A 51 actual versus 53 consensus is a downside surprise despite remaining in expansion territory.
- A 49 actual versus 47 consensus may be a positive surprise despite remaining below 50.
Markets trade new information relative to what was expected. Positioning also matters: a seemingly strong report may fail to lift a currency if traders had anticipated an even stronger result. Conversely, a sub-50 number can accompany currency strength if it is less weak than feared or if inflation components strengthen expected rate support.
Example: Manufacturing PMI prints 50.8 versus 52.0 expected, while prices paid accelerates. Growth news disappoints, but inflation news may reduce expectations for near-term rate cuts. The FX implication is mixed.
Common mistake: “Above 50, buy; below 50, sell.”
Professional tip: Describe the report with two axes—growth impulse and inflation impulse—before translating it into policy expectations.
Manufacturing, Services, and Composite PMI#
| Release | Main focus | Components worth checking | Interpretation caution |
|---|---|---|---|
| Manufacturing PMI | Factory output and operating conditions | New orders, production/output, employment, inventories, input/output prices, supplier deliveries | Delivery delays can raise some indices even when disruption—not demand—is responsible |
| Services PMI | Business activity across covered service industries | Business activity, new business/orders, employment, prices, expectations | Service inflation and labor intensity can matter greatly for policy, but coverage varies |
| Composite PMI | Combined private-sector activity signal | Underlying output/business-activity measures and sector contributions | It is not a simple average of the two headline PMIs |
Detailed Explanation
Manufacturing often has strong links to trade, inventories, and global demand. Services may better reflect a large share of activity in service-heavy economies and can be informative about wage-sensitive inflation. Neither deserves an automatic priority: the market focus changes with the policy debate.
If a central bank is worried about persistent service inflation, a strong services prices reading may matter more than a modest factory rebound. During an export downturn, manufacturing new orders may carry more information for a trade-sensitive currency.
Composite PMI combines covered sectors through the provider's methodology and economic weights. Do not calculate (manufacturing headline + services headline) ÷ 2. The underlying series and weights are not that simple.
Example: Manufacturing weakens to 48 while services strengthens to 54. A composite reading can still indicate private-sector growth, but its value depends on sector weights and underlying output—not a 51 arithmetic average invented by the trader.
Common mistake: Assuming manufacturing must dominate because markets historically watched factories first.
Professional tip: Match the component to the live macro question: growth breadth, labor demand, service inflation, export demand, or supply constraints.
S&P Global PMI vs ISM: Do Not Treat Them as Duplicates#
Short Answer
S&P Global and the Institute for Supply Management run separate surveys with different panels, methodologies, classifications, weights, and publication structures. Both can be useful; disagreement is information, not necessarily an error.
S&P Global provides a dedicated PMI and ISM comparison. In the United States, traders may see S&P Global manufacturing/services releases and later ISM Manufacturing or Services reports. Similar labels do not make the readings interchangeable.
| Question | S&P Global PMI | ISM Report On Business |
|---|---|---|
| Who publishes it? | S&P Global Market Intelligence | Institute for Supply Management |
| Geographic scope | Many economies and regions | United States |
| Survey panel/method | Provider-specific methodology | ISM member-based survey methodology |
| Headline construction | Depends on the published PMI series | ISM Manufacturing PMI and Services PMI use ISM-defined components |
| Best practice | Read S&P documentation and release | Read ISM release, tables, and respondent comments |
Example: S&P Global US Services can improve while ISM Services softens because they are distinct samples and constructs. The task is to ask whether the combined evidence changes the macro narrative.
Common mistake: Calling the second release a “confirmation” only when it matches the first.
Professional tip: Maintain separate historical series and consensus records. Never splice S&P and ISM values into one chart as if they were identical.
Flash vs Final PMI#
Short Answer
Flash PMI is an early estimate based on a substantial but incomplete share of monthly responses. Final PMI incorporates additional responses and may revise the flash figure.
Flash releases often attract the larger immediate reaction because they provide the first broad signal for the month. Final releases can still matter when the revision is meaningful, components alter the interpretation, or the market is unusually sensitive to growth data. Verify each date in the S&P Global release calendar.
Example: Flash services PMI is 51.6, then final is 50.9. The final remains above 50 but revises the strength lower. Whether the currency reacts depends on consensus for the final, component details, and what occurred between releases.
Common mistake: Treating flash as complete or assuming final cannot move markets.
Professional tip: Label every chart entry “flash” or “final,” and save the value known at the time. A revised database can otherwise create hindsight bias.
Release Calendar and Time-Zone Cautions#
PMI releases do not share one universal hour. Countries, publishers, daylight-saving regimes, holidays, flash/final rounds, and manufacturing/services schedules differ.
Before every release:
- Verify the date and time on the publisher's official calendar.
- Confirm the time zone shown and convert it for the release date—not today's offset.
- Check whether the United States and your location change clocks on different dates.
- Confirm whether your economic calendar displays browser, exchange, UTC, or broker-server time.
- Check for nearby inflation, labor, GDP, central-bank, or geopolitical events.
- Note whether ISM and S&P Global US releases occur at different times.
The ISM Report On Business calendar and S&P calendar are primary references. A screenshot saved weeks earlier can become stale.
Common mistake: Hard-coding “PMI is always at X UTC.”
Professional tip: Put both official release time and broker-platform time in the plan, then set an alert well before the event.
Actual vs Consensus, Prior, and Revisions#
Short Answer
The key first calculation is usually surprise = actual − consensus, but it is incomplete without prior data, revisions, components, and market pricing.
Use this sequence:
- Identify the exact series. Country, provider, sector, flash/final, headline.
- Record consensus. Prefer a reputable median and timestamp it.
- Record prior and revised prior. A prior of 52.0 revised to 51.2 changes momentum.
- Calculate the headline surprise. Keep units consistent.
- Read components. Determine whether the signal is broad, inflationary, or fragile.
- Compare with positioning and policy narrative. Was a large beat already expected?
Example: Actual services PMI 53.0 versus 51.8 consensus looks positive. But if the prior is revised from 52.5 to 53.4, employment contracts, and prices cool sharply, the policy implication may be less supportive than the headline suggests.
Common mistake: Comparing actual only with the unrevised prior.
Professional tip: Separate “data surprise” from “price response.” If a currency cannot strengthen on supportive news, that failed response may reveal positioning—but it still is not a guaranteed reversal signal.
A Component-Reading Framework#
| Component | Question to ask | Possible macro channel |
|---|---|---|
| Output/business activity | Is current activity accelerating or slowing? | Near-term growth expectations |
| New orders/new business | Is future demand broadening? | Forward activity and persistence |
| Employment | Are firms adding or reducing staff? | Labor demand, income, policy |
| Input/output prices or prices paid | Is cost pressure rising, and is it passed on? | Inflation and rate expectations |
| Backlogs | Is capacity pressure building? | Future production or bottlenecks |
| Inventories | Is stock accumulation intentional or demand-related? | Future production adjustment |
| Supplier deliveries | Are delays demand-led or disruption-led? | Growth versus supply-shock ambiguity |
| Business expectations | How confident are respondents? | Forward sentiment, often noisy |
First classify each component as stronger, weaker, or ambiguous versus prior and expectation. Then judge breadth. A headline beat led only by supplier delays may deserve a different interpretation from one supported by output and new orders.
Professional tip: Read respondent commentary as context, not a representative statistical sample on its own. Quotable anecdotes can explain a mechanism but should not override the aggregate survey.
How PMI Can Reach Currency Prices#
PMI does not mechanically push a currency. It can alter several linked expectations:
- Relative growth: Stronger activity versus another economy may attract capital or change the relative outlook.
- Inflation: Prices and capacity pressure can affect expected central-bank reaction.
- Interest-rate path: Traders may reprice cuts, hikes, or the duration of restrictive policy.
- Bond yields: Changes in expected policy and inflation can move government yields and cross-country yield differentials.
- Risk sentiment: Global manufacturing news can affect equities and cyclical currencies.
- Terms of trade and exports: New export orders can matter for trade-sensitive economies.
- Positioning: Crowded positions can produce “good news, weak currency” or sharp short covering.
Federal Reserve research discusses how macroeconomic announcements affect foreign exchange. The lasting response depends on what was unexpected and whether policy expectations actually change.
Example: A UK services PMI beat with stronger prices could lift expected UK rates relative to peers and support sterling. Yet GBP may fall if the beat was priced in, global risk sentiment deteriorates, or the Bank of England is focused on different evidence.
Common mistake: Explaining every move with the PMI headline after the fact.
Professional tip: Monitor the most relevant short-maturity government yield and the currency simultaneously. Agreement can strengthen an interpretation; disagreement is a reason to slow down.
Mixed-Signal Case Study: July 2026 ISM Services#
The ISM July 2026 Services report illustrates why headline-only trading is inadequate:
- Services PMI: 54.1
- Business Activity: 59.1
- New Orders: 57.2
- Employment: 47.4
- Prices: 70.3
The headline, business activity, and new orders indicated expansion. Employment was below 50, while prices were elevated. A disciplined interpretation is “solid current activity and demand, weak surveyed employment, and substantial price pressure”—not simply “54.1, therefore buy USD.”
For the dollar, growth resilience and price pressure could reduce expectations for rapid Federal Reserve easing, which may be supportive through yields. But employment weakness could temper that conclusion. The actual currency response would still depend on consensus, prior values and revisions, Treasury yields, existing positions, and concurrent news.
Common mistake: Averaging conflicting components into a confident directional call.
Professional tip: When growth and inflation point one way but employment points another, define what confirmation would be required—such as a sustained yield move and orderly FX structure—or choose no trade.
Pre-Release, During-Release, and Post-Release Workflow#
Before the release#
- Verify the official event, time, and flash/final status.
- Record consensus, prior, revisions, and recent trend.
- Identify the central bank's current concern: growth, inflation, labor, or financial stability.
- Map directly exposed pairs and overlapping positions.
- Create beat, miss, mixed, and no-trade scenarios.
- Mark invalidation levels and calculate size before volatility rises.
- Decide a maximum acceptable spread; if it is unavailable or exceeded, do not enter.
During the release#
- Confirm the value belongs to the correct series.
- Read revisions and at least the major components.
- Observe yields and the relevant currency response.
- Avoid chasing a price already far from a definable invalidation level.
- Do not widen a stop merely to avoid realizing a loss.
- Remember that a standard stop-loss fill is not guaranteed.
After the release#
- Wait for spreads and price discovery to become usable for your method.
- Ask whether the initial move is confirmed by components and cross-markets.
- Enter only with a defined thesis, invalidation, and position size.
- Record actual fill, spread, slippage, screenshots, and decision quality.
- Review the process, not only profit or loss.
Use the forex news spread and slippage log to turn observation into evidence. For position sizing and correlated exposure, use the forex risk management guide.
When Not to Trade PMI#
No trade is a complete decision when:
- Headline and key components materially conflict.
- Consensus sources disagree or the series is mislabeled.
- A prior value was revised enough to obscure momentum.
- Another major release or central-bank speaker overlaps.
- Price has moved before you can verify the report.
- Spreads, liquidity, or platform performance are abnormal.
- Your stop has no logical invalidation point.
- Position size cannot keep a plausible adverse fill within your limit.
- You already hold correlated currency exposure.
- You feel compelled to recover a previous loss or “not miss” the event.
Beginners should read should beginners trade CPI, NFP, and forex news?. Watching without trading is useful training.
Execution Risks Around PMI#
Fast releases can produce spread widening, slippage, rejected or delayed orders, gaps between available quotes, false breaks, and rapid reversals. A stop-loss controls the instruction you send; it does not guarantee the exact fill price unless a broker explicitly offers and honors a guaranteed-stop product under stated terms.
Pending stop entries are also exposed: activation may occur near the worst part of a spike. Limit orders control price but not execution; they may remain unfilled or receive only available liquidity. Broker behavior, instrument structure, and market conditions differ, so unsupported universal spread or slippage statistics are misleading.
Common mistake: Backtesting the mid-price candle with zero transaction costs and assuming it represents tradable execution.
Professional tip: Keep release-specific records from your own broker and account type. If the strategy depends on a perfect first-second fill, it is not realistically testable for most manual retail traders.
Practical PMI Checklist#
- Official publisher, country, sector, and series verified
- Flash or final status verified
- Release time and time-zone conversion verified
- Consensus source and timestamp recorded
- Prior and revised prior recorded
- Headline surprise calculated
- Output/business activity checked
- New orders/new business checked
- Employment checked
- Prices checked
- Supplier deliveries and backlogs interpreted carefully
- Central-bank relevance stated in one sentence
- Government yields and related markets observed
- Correlated exposure counted
- Thesis and invalidation written
- Position size calculated from risk, not excitement
- Spread and execution conditions checked
- No-trade condition accepted
- Post-event journal and screenshots saved
Glossary#
PMI: Purchasing Managers' Index, commonly a survey-based diffusion index of changes in business conditions.
Diffusion index: An index combining the shares reporting improvement, no change, and deterioration.
Manufacturing PMI: A PMI focused on manufacturing operating conditions.
Services PMI: A PMI focused on covered service-sector business conditions.
Composite PMI: A combined private-sector activity measure constructed from underlying sector data and weights; not a simple headline average.
Flash PMI: An early monthly estimate based on responses available before the final cutoff.
Final PMI: The later estimate incorporating additional survey responses and possible revisions.
Consensus: The central forecast, often a median, collected before release.
Surprise: The difference between actual and expected data.
Revision: A change to a previously published estimate.
New orders: A forward-looking survey measure of incoming demand.
Prices paid/input prices: A measure related to firms' cost pressures.
Slippage: A difference between expected or triggered price and actual fill.
Whipsaw: A rapid move in one direction followed by a reversal.
Build the Wider Fundamental-Analysis Framework#
PMI becomes more useful when connected to policy and other releases. Continue with:
- Fundamental analysis guide — the pillar page for macro-to-FX reasoning
- How interest rates and central banks affect forex — the main transmission channel
- Economic calendar reading guide — release preparation and consensus
- Economic events that move markets — event hierarchy and interaction
- NFP trading guide — labor-release component reading
- Forex risk management guide — sizing, stops, and portfolio exposure
Future cluster articles should cover PMI new orders and recession signals, services prices and central-bank policy, S&P Global versus ISM historical interpretation, and a country-by-country PMI release calendar guide. These would connect back to this article and the fundamental-analysis pillar rather than becoming orphan pages.
Final Takeaway#
The professional use of PMI is not “above 50, buy.” It is a structured comparison of the exact release against expectations, history, components, revisions, policy context, cross-market confirmation, and executable risk. A 55 PMI is not 5% growth; a sub-50 reading is not automatically recession; flash can revise; composite is not a simple average; and even a correct macro interpretation can lose money through timing or execution.
Prepare scenarios, verify primary sources, size for adverse fills, and treat no trade as a successful outcome whenever the evidence or market conditions are unclear.
Comments
Add a useful note for other traders. We review comments before publishing.